
Extended Data Figure 3 |. Adjustment of the ongoing dataset using young individuals improves its correlation with the snapshot dataset.
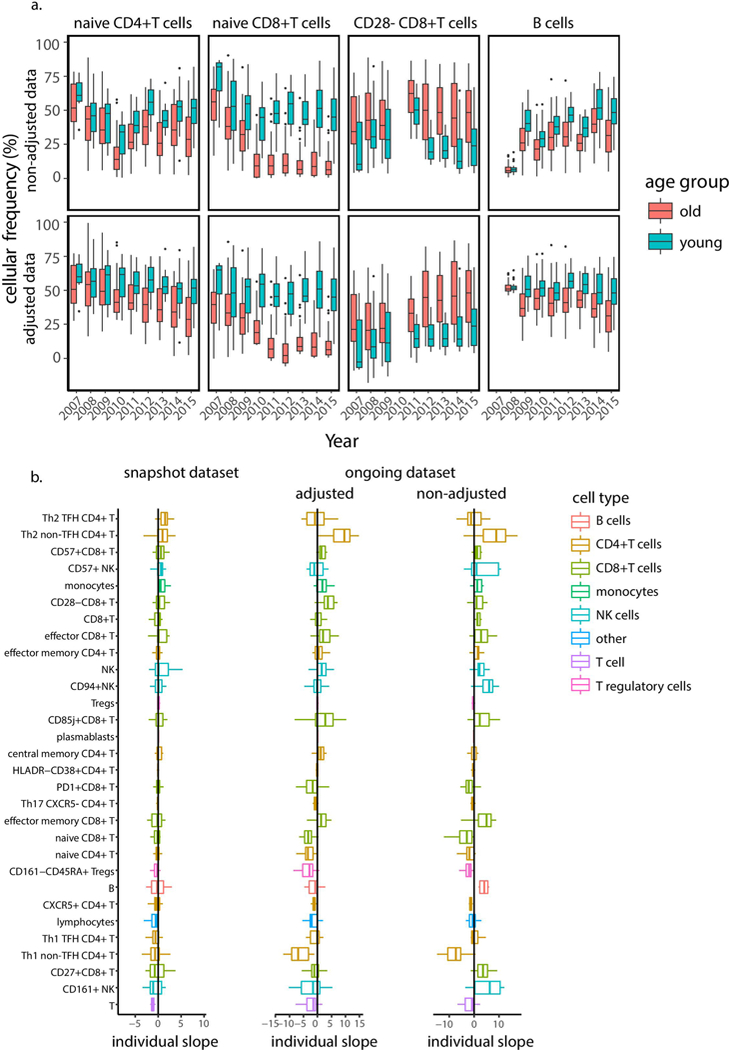
a,, Boxplots of representative cell-subset frequencies in 72 old (pink) and 63 young (light blue) adults before (upper panels) and after (lower panels) adjustment for young individuals. Boxes represent 25th and 75th percentiles around the median (line). Whiskers, 1.5× interquantile range. b, Individual slopes of frequencies of 30 immune cell subsets identified as associated with age calculated based on the snapshot (left), adjusted ongoing (middle) and nonadjusted ongoing (right) data sets. Adjustment of the ongoing data set improved the correlation between the slopes measured in the snapshot and ongoing data sets from 0.29 (linear regression P = 0.12, n = 30) to 0.54 (linear regression P = 0.004, n = 30). Boxes represent 25th and 75th percentiles around the median (line). Whiskers, 1.5× interquantile range.