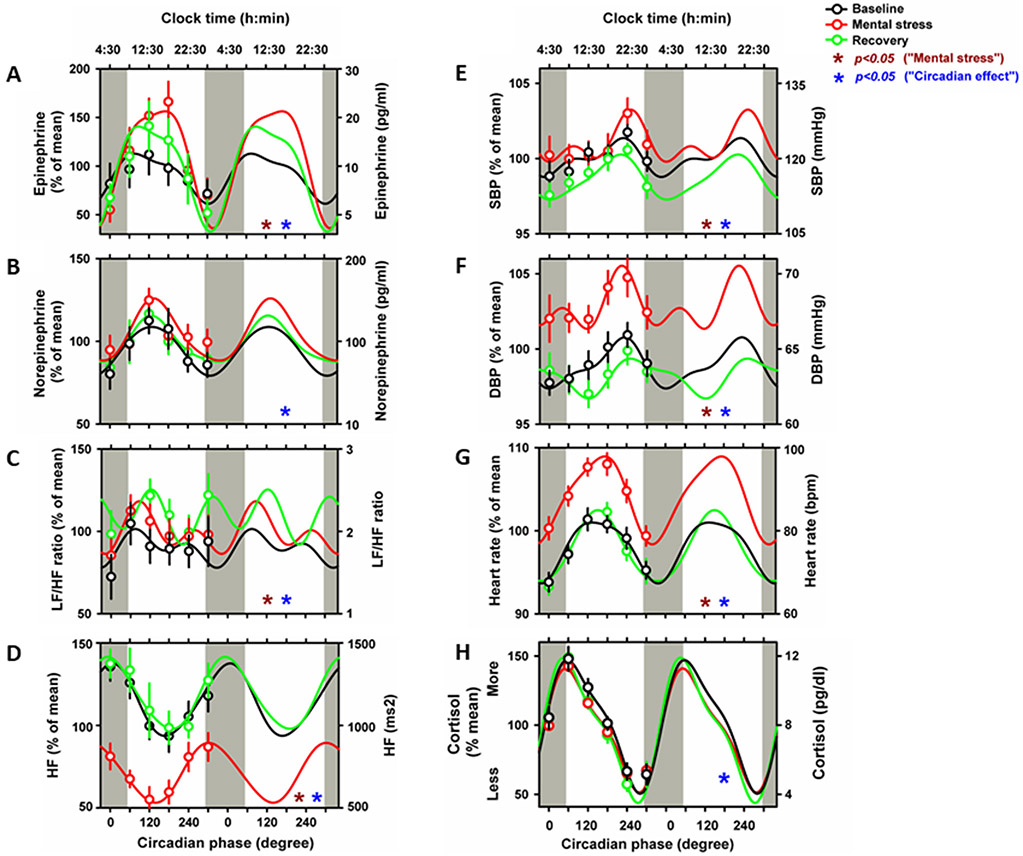
Figure 2. Mental stress and circadian effects on human cardiovascular function.
Cosinor models of circadian rhythms of Epinephrine (A), norepinephrine (B), LF/HF ratio (C), HF power (D), SBP (E), DBP (F), heart rate (G) and cortisol (H) during baseline (black lines), mental stress (red lines) and recovery (green lines). Cosinor analyses were performed on the 360° data sets, whereas data are double plotted (two identical circadian cycles) to aid visualization of rhythmicity. To show that these models adequately fit the actual data, we also plot average data grouped into 60 circadian degree bins with SEM error bars (averaged data are not double plotted). Bottom x-axes, circadian phase with 0° indicating circadian core body temperature minimum (average: ~4AM); top x-axes, corresponding average clock time; left y-axes, percentage of each participant’s mean across the days under forced desynchrony; right y-axes, absolute values. Maroon stars: “mental stress effect”; Blue stars: “circadian effect”; p<0.05.

