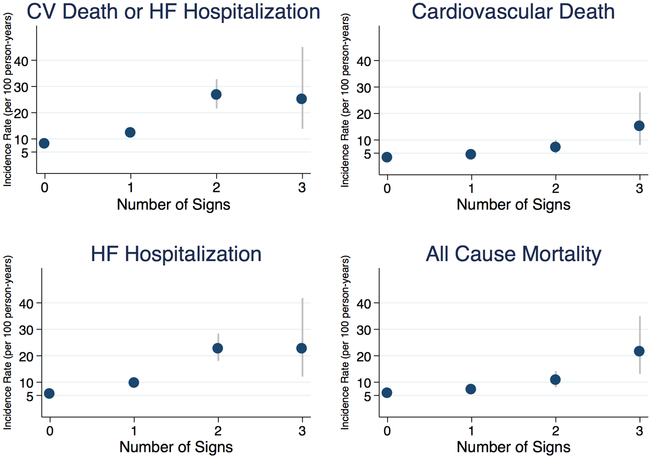
Figure 1: Incidence Rates of Adverse Cardiovascular Events by Number of Signs of Congestion.
Incidence rates expressed per 100 person-years shown by time-updated number of signs of congestion. Increasing number of signs of congestion was associated with increasing risk for each cardiovascular outcome. The corresponding incidence rates are shown in Supplementary Table 5. CV, cardiovascular; HF, heart failure.

