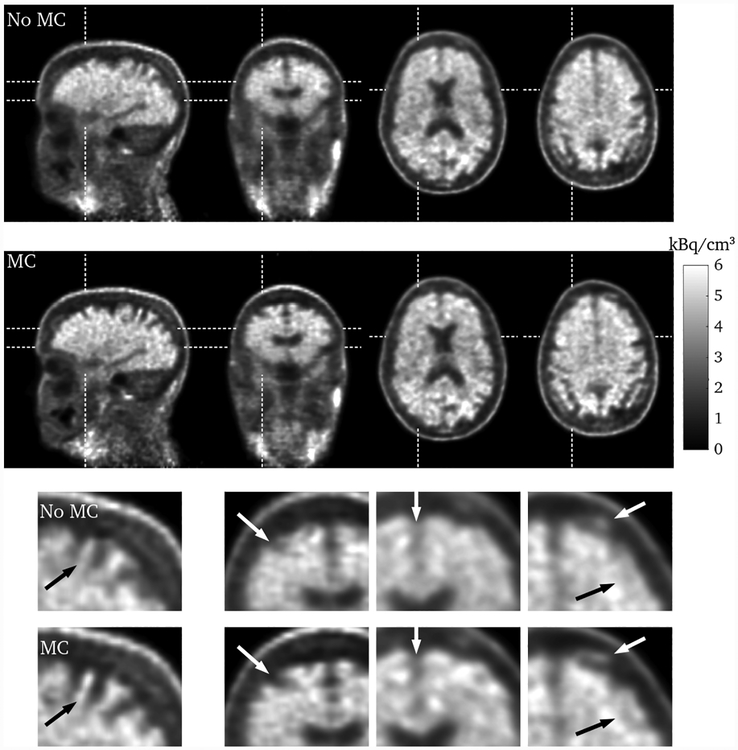
Fig. 10.
Sagittal, coronal, and two transverse slices through the brain for the entire scan duration, without (first row) and with (second row) motion correction. The bottom two rows show zoomed in sections of the images. The dashed lines indicate from where the slices are taken, and the red arrows highlight regions where the effect of the motion correction can be seen.

