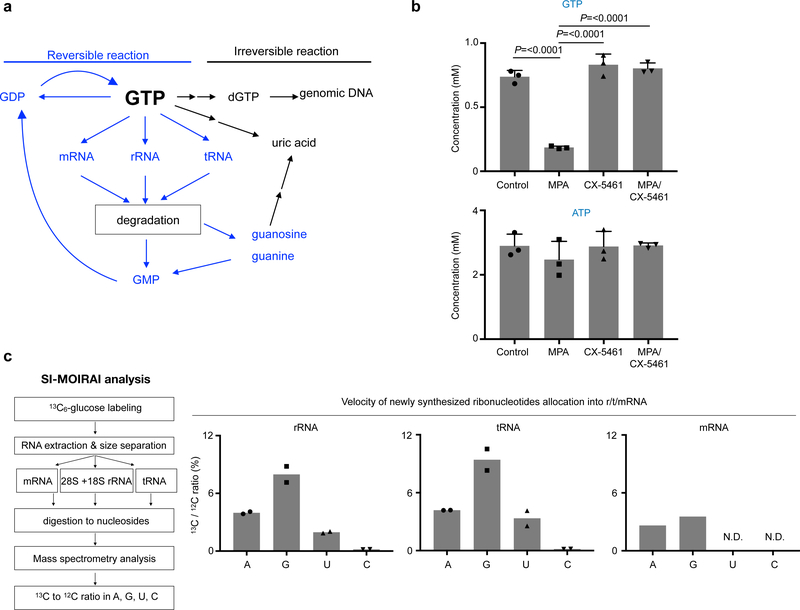
Fig. 5 |. SI-MOIRAI analysis identified metabolic fate of GTP for rRNA and tRNA synthesis.
a, A schematic diagram of reversible and irreversible reaction of GTP metabolism.
b, GTP depletion by IMPDH inhibition is abolished by Pol I inhibition. GTP and ATP concentrations quantified by HPLC in 10 μM MPA (4 h) and 1 μM CX-5461 (CX) (5 h including 1 h pretreatment)-treated U87MG cells. Data are presented as mean+s.d. n=3 biologically independent samples. One-way ANOVA.
c, A schematic flow of SI-MOIRAI analysis (left). Metabolic utility of newly synthesized nucleotides into r/m/tRNA. Ratio of the newly synthesized 13C-labeled nucleosides to total nucleosides in indicated RNA species are shown as percentile (right). n=2 biologically independent samples for r/tRNA, n=1 sample for mRNA. N.D. stands for not detectable.

