Figure 1.
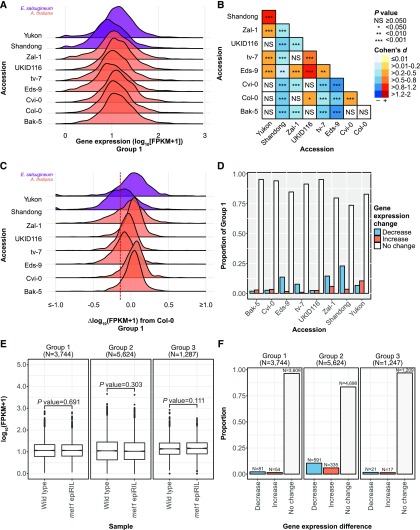
No direct and consistent consequences to gene expression following the loss of gbM. (A) Ridge plot of gene expression for the same 1,328 genes across accessions and genotypes. All genes have lost gbM in E. salsugineum Shandong and Yukon, whereas all genes maintain gbM in A. thaliana accessions (Group 1). (B) Pair-wise comparison of gene expression for Group 1 between species (E. salsugineum-A. thaliana) and within species (E. salsugineum-E. salsugineum and A. thaliana-A. thaliana). Significance is represented by asterisks. Color of cell indicates direction and effect size of difference relative to the x-axis. The effect size is represented as Cohen’s d. (C) Ridge plot of gene expression differences for each genotype and accession relative to A. thaliana Col-0. Gene expression differences ≤-1.0 and ≥1.0 log10(FPKM+1) were collapsed to -1.0 and 1.0, respectively. Dashed red line indicates the average difference in gene expression reported by Muyle and Gaut (2019) for Group 1 genes between E. salsugineum and A. thaliana Col-0 (-0.14 log10[FPKM+1]). (D) Bar plot of discrete differences in genes expression for each accession and genotype relative to A. thaliana Col-0. (E) Distribution of gene expression for Group 1, Group 2, and Group 3 genes between wild type and met1 epiRIL. Gene expression was averaged per gene across three wild type and met1 epiRIL RNA-seq libraries, respectively. Boxplot elements: center line, median; upper and lower “hinges”, first and third quartiles (the 25th and 75th percentiles), respectively; whiskers, 1.5× interquartile range; large points, outliers. (F) Bar plot of discrete differences in genes expression for Group 1, Group 2, and Group 3 genes between wild type and met1 epiRIL.

