Figure 3.
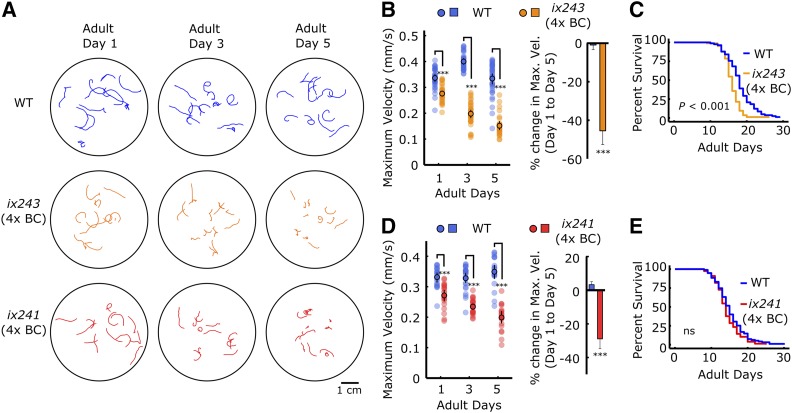
ix241 and ix243 worms show progressive locomotor decline after four backcrosses (A) Representative locomotor tracks from 1-min video recordings of WT, ix243 backcrossed four times (4x BC), and ix241(4x BC) on adult days 1, 3, and 5 on plates with no food. n = 10–15 tracks per plate (some worms were unable to be tracked for a full minute, and were removed from analysis) (B) (Left) Maximum velocities of WT and ix243(4x BC) worms. (Right) Percent change in maximum velocity of WT and ix243(4x BC) worms on adult day 5 compared to adult day 1. (C) Survival curve of WT (n = 56) worms and ix243(4x BC) (n = 89) worms. (D) (Left) Maximum velocities of WT and ix241(4x BC) worms. (Right) Change in maximum velocity of WT and ix241(4x BC) worms. (E) Survival curve of WT (n = 94) and ix241(4x BC) (n = 77) worms. Error bars indicate 95% confidence intervals. For maximum velocity experiments, n = 30–45 worms per strain for each day (10–15 worms from 3 biological replicate plates). For percent change in maximum velocity graphs, n = 3 biological replicate plates. ***P < 0.001; ns, not significant; Unpaired Student’s t-test for maximum velocity comparisons; Log-rank test for lifespan comparisons.

