Figure 4.
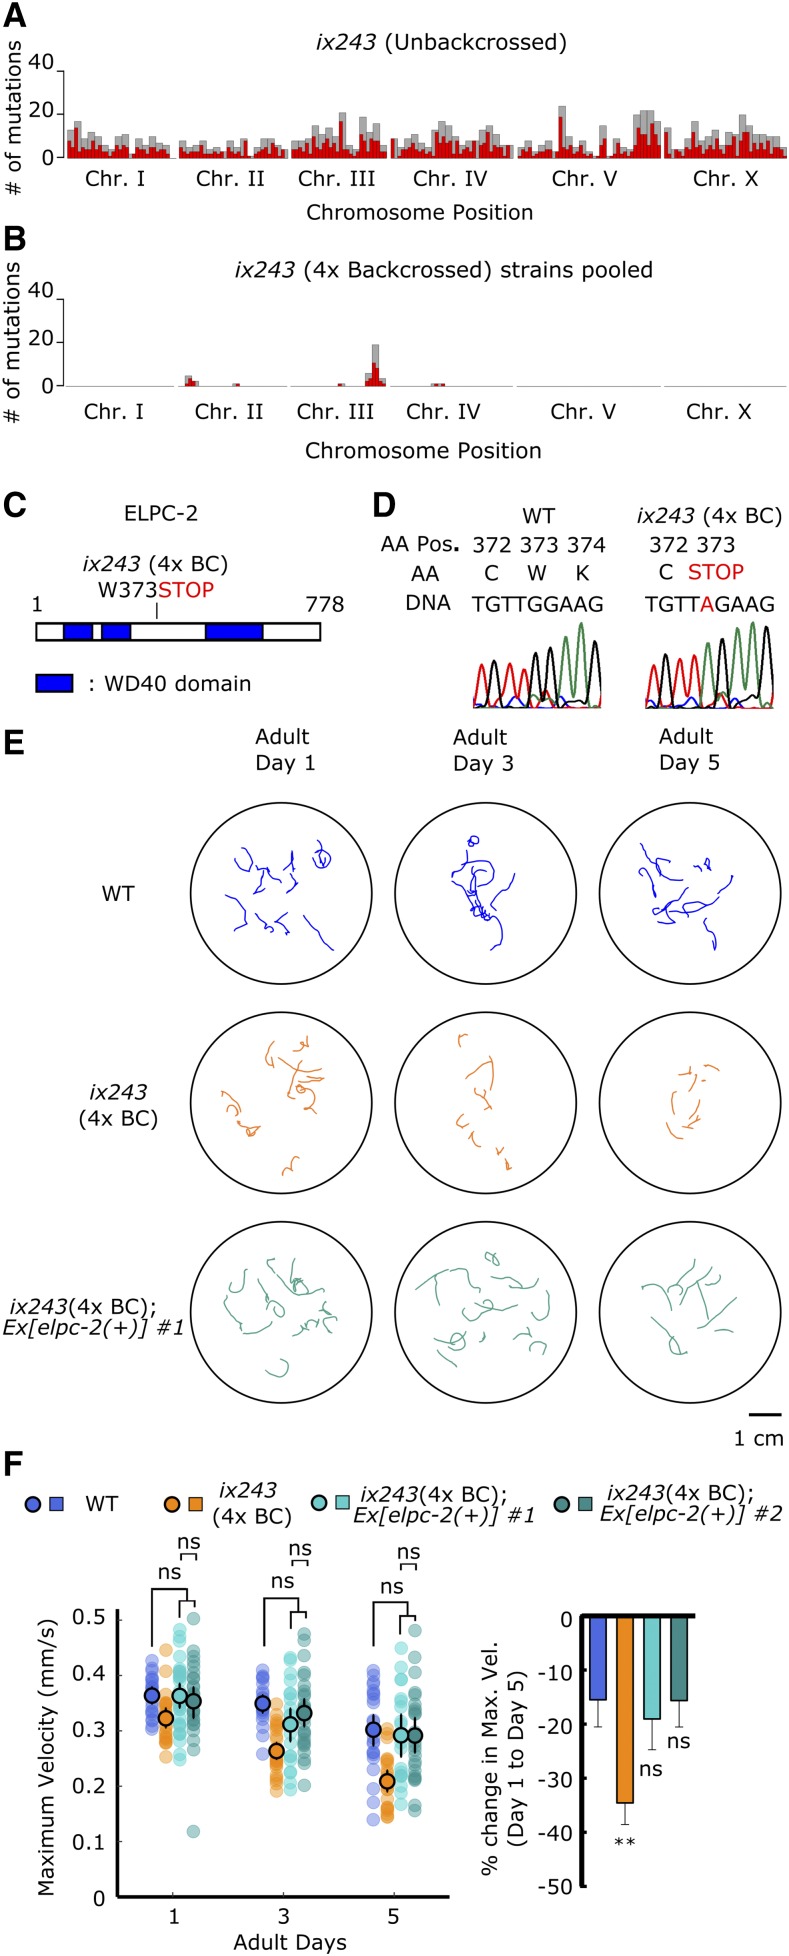
elpc-2 mutation causes locomotor deficits in the ix243 mutant strain (A) Mutation frequency along each chromosome of ix243 mutant strain before backcrossing. Red bars indicate 0.5-Mb bins and gray bars indicate 1.0-Mb bins. (B) Mutation frequency along each chromosome for pooled ix243(4x BC) worms. (C) Schematic diagram of ELPC-2 protein and location of mutation site in ix243 allele. (D) ix243 mutation site on ELPC-2 amino acid (AA) sequence and elpc-2 DNA sequence. (E) Representative locomotor tracks of WT, ix243(4x BC), and ix243(4x BC);Ex[elpc-2(+)] #1 worms. (F) (Left) Maximum velocities of WT, ix243(4x BC), ix243(4x BC);Ex[elpc-2(+)] #1, and ix243(4x BC);Ex[elpc-2(+)] #2 worms. n = 30–45 worms per strain for each day (10–15 worms from 3 biological replicate plates). (Right) Percent change in maximum velocity of worms from left panel. n = 3 biological replicate plates. Error bars indicate 95% confidence intervals. **P < 0.01; ns, not significant; One-way ANOVA with Dunnett’s post hoc test vs. WT.

