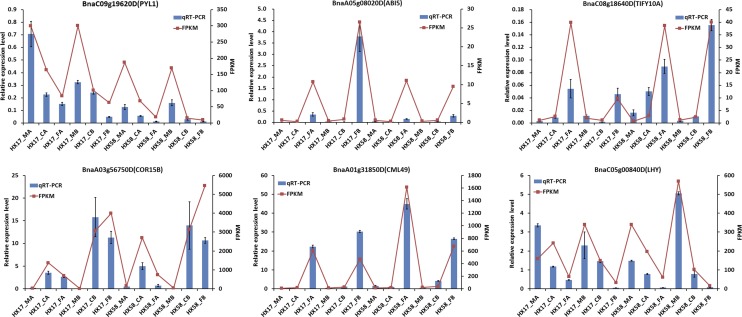
Figure 11.
qRT-PCR verification of 6 selected DEGs. Comparison of qRT-PCR (blue bar) with FPKM data (red line). The relative changes were calculated with 2-∆Ct and the rapeseed BnaActin gene was amplified as the reference gene. The relative qRT-PCR expression level (selected DEG/ BnaActin) is shown on the left y-axis. The relative transcript level was determined and normalized using the reference level and averaged over the three technical replicates. The FPKM from the RNA-Seq data are indicated on the right y-axis.

