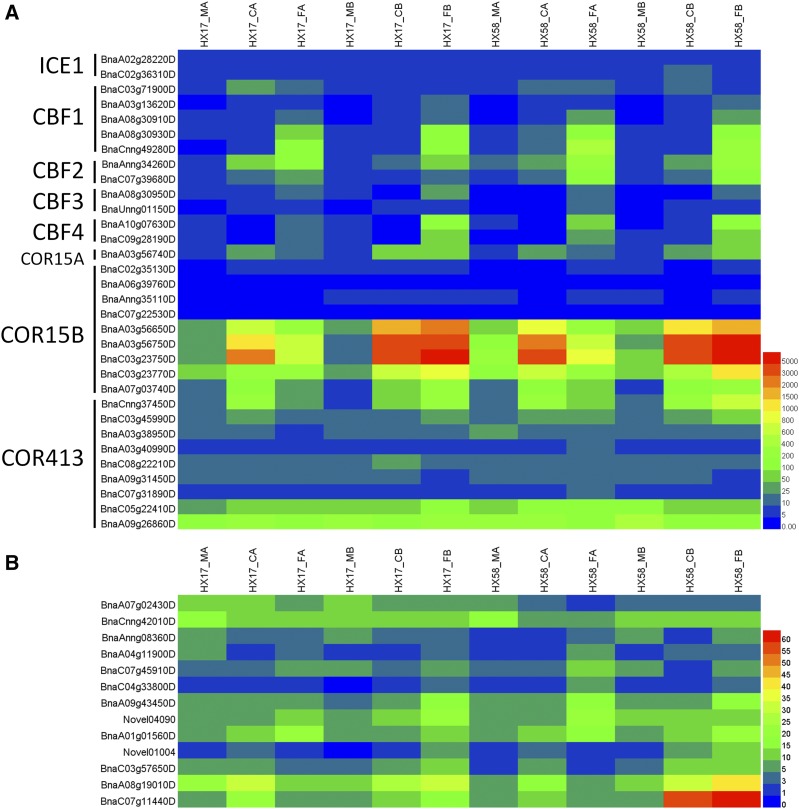
Figure 7.
Heatmap analysis of the ICE-CBF-COR signal pathway (A) and cold shock domain-containing proteins (B). ICE1 (Inducer of CBF expression 1), bHLH transcription factor; CBF (C-repeat-binding factor), dehydration-responsive element-binding protein; COR, cold-regulated. The expression levels of each gene (FPKM values) in each sample, as indicated by different color rectangles. Red means high expression; Blue means low expression.

