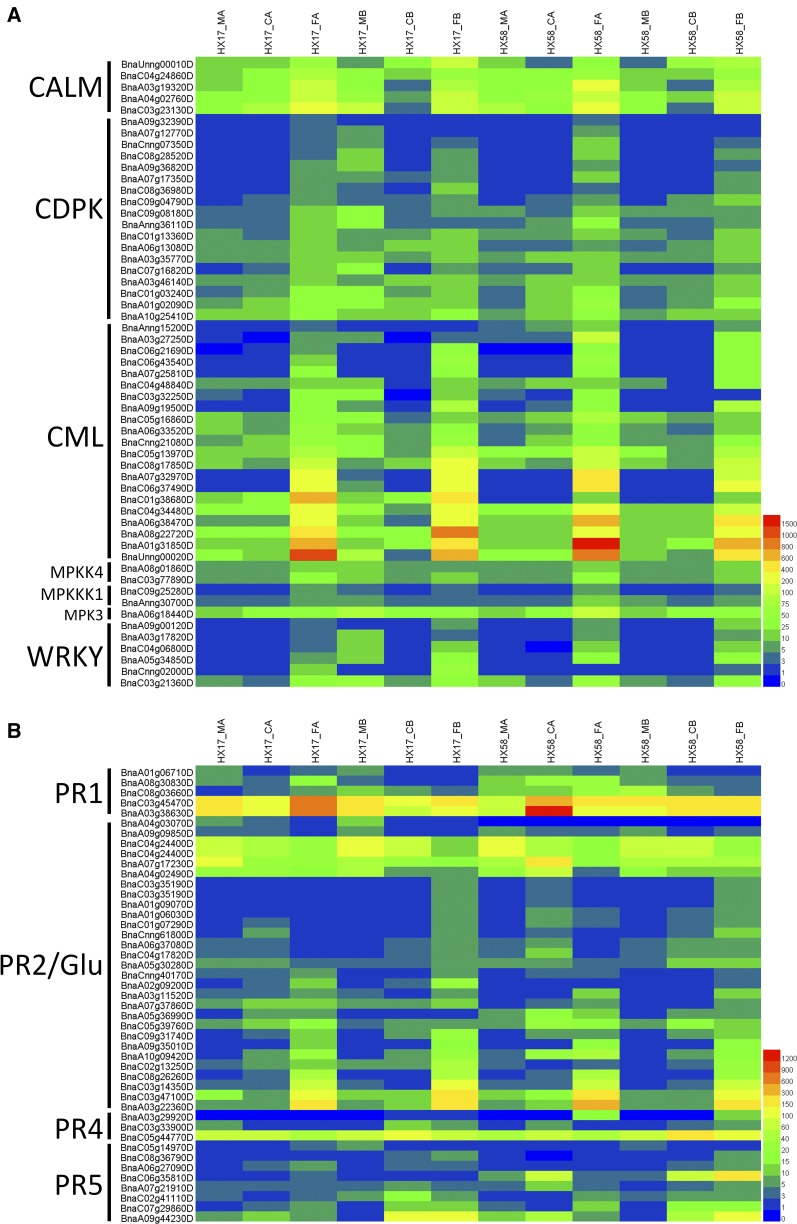
Figure 8.
Heatmap analysis of the regulator genes (A) and PR genes (B) in the plant-pathogen interaction pathway. CAML, Calmodulin, CDPK; Calcium-dependent protein kinase; CML, calcium-binding protein; MPK3, Mitogen-activated protein kinase 3; MPKK4, Mitogen-activated protein kinase kinase 4; MPKKK1, Mitogen-activated protein kinase kinase kinase 1; WRKY, WRKY transcription factor; PR, Pathogenesis-related protein; Glu, Glucan endo-1,3-beta-glucosidase. The expression levels of each gene (FPKM values) in each sample, as indicated by different color rectangles. Red means high expression; Blue means low expression.

