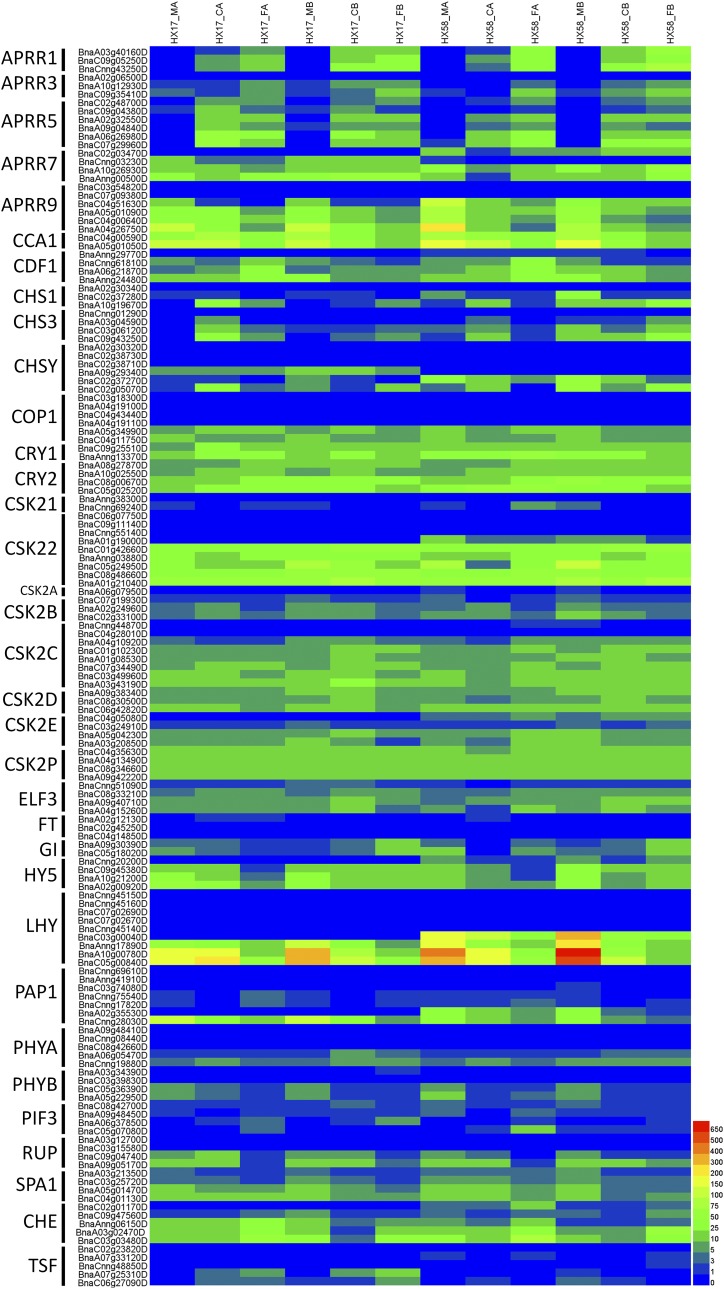
Figure 9.
Heatmap analysis of the genes in circadian rhythms pathway. APRR (pseudo response regulator), Two-component response regulator-like; CCA1 (CIRCADIAN CLOCK ASSOCIATED 1), MYB-related transcription factor; CDF1 (Cyclic dof factor 1), Dof zinc finger protein; CHS (Chalcone synthase); COP1 (Constitutive photomorphogenesis protein 1), E3 ubiquitin-protein ligase; CRY1/2 (Cryptochrome 1/2), Blue light photoreceptor; CSK2, Casein kinase II subunit; ELF3 (EARLY FLOWERING 3); FT (FLOWERING LOCUS T), Phosphatidylethanolamine-binding protein; GI (GIGANTEA); HY5 (ELONGATED HYPOCOTYL5), bZIP transcription factor; LHY (LATE ELONGATED HYPOCOTYL), MYB-related transcription factor; PAP1(Production of anthocyanin pigment 1 protein), MYB-related transcription factor; PHYA/B (Phytochrome A/B), ; PIF3 (Phytochrome-interacting factor 3), bHLH transcription factor; RUP1, WD repeat-containing protein; SPA1 (SUPPRESSOR OF PHYA-105 1), WD repeat-containing protein; CHE (CCA1 HIKING EXPEDITION), TCP transcription factor; TSF (TWIN SISTER of FT). The expression levels of each gene (FPKM values) in each sample, as indicated by different color rectangles. Red means high expression; Blue means low expression.

