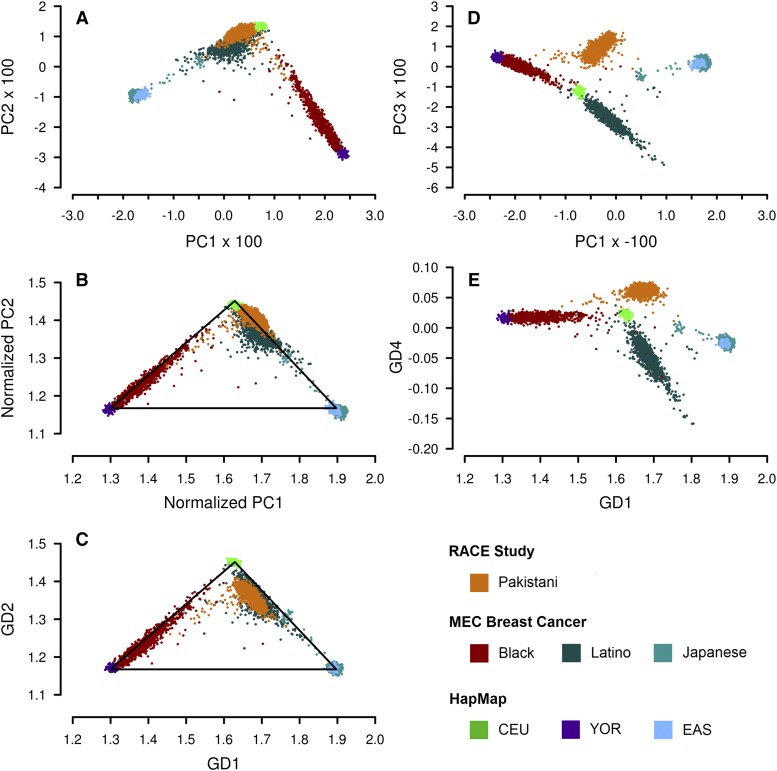
Figure 6.
Results generated by applying EIGENSTRAT and GRAF-pop on the combined dataset of phs000050.v1 (HapMap), phs000456.v1 (Risk Assessment of Cerebrovascular Events (RACE) Study) and phs000517.v3 (Multiethnic Cohort (MEC) Breast Cancer Genetics) to infer subject ancestry. 7,790 SNPs are included in the test data set, with genotype missing rate less than 5% for each subject. (A) EIGENSTRAT, PC2 vs. PC1. (B) EIGENSTRAT, PC2 vs. PC1, after normalization. (C) GRAF-pop, GD2 vs. GD1. (D) EIGENSTRAT, PC3 vs. PC1. (E) GRAF-pop, GD4 vs. GD1.

