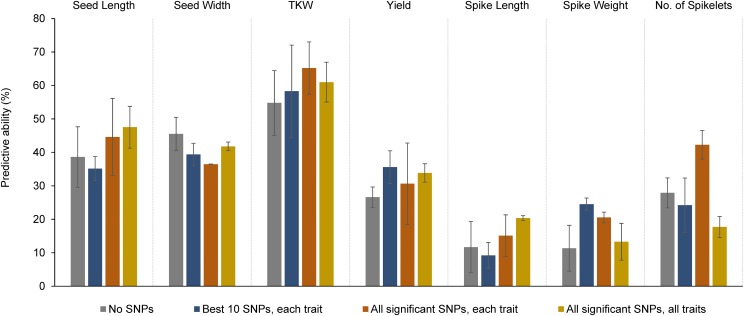
Figure 6.
Effect on predictive abilities of traits when using significant SNPs as fixed effects in genomic selection models. Best 10 SNPs for each trait are the ones with highest amount of percentage of phenotypic variance explained (R2). Error bars represent the standard deviation of predictive ability values obtained from each model.

