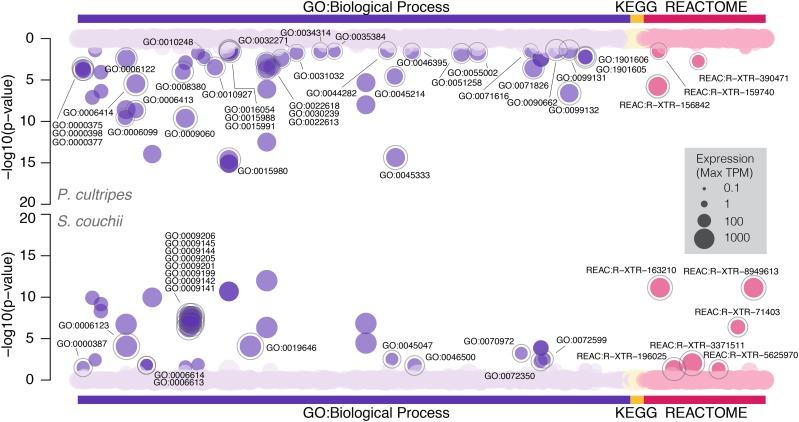
Figure 3.
gProfiler gene pathway enrichment showing symmetrical Manhattan plots of annotated terms and gene pathways for P. cultripes (above) and S. couchii (below). Color code reflects annotation domains (Gene Ontology - Biological Processes, KEGG and Reactome gene pathways) with darker shading highlighting overrepresented terms (adj. P < 0.05). Term size reflects mean expression (TPM) and overrepresented terms that are unique to each species are outlined in gray and labeled.

