

Abstract
Objectives
Liver kinase B1 (LKB1) is considered a tumour suppressor that can control cell growth and metabolism. Whether LKB1 expression levels are related to clinicopathology and prognosis is controversial. This review aimed to quantitatively examine the latest evidence on this question.
Design
An updated systematic review and meta-analysis on the association between LKB1 expression and prognosis of patients with solid tumours were performed.
Data sources
Eligible studies were identified through literature searches from database establishment until 15 June 2018 in the following databases: Embase, PubMed, Web of Science, Cochrane Library, China National Knowledge Infrastructure and Wan Fang databases.
Eligibility criteria
The association between LKB1 expression and clinicopathological characteristics, overall survival (OS), disease-free survival (DFS) and relapse-free survival (RFS) of patients with solid tumours were reported. Sufficient data were available to calculate the OR or HR and 95% CI.
Data extraction and synthesis
Relevant data were meta-analysed for OS, DFS, RFS and various clinical parameters.
Results
The systematic review included 25 studies containing 6012 patients with solid tumours. Compared with patients with high LKB1 expression, patients with low expression showed significantly shorter OS in univariate analysis (HR=1.63, 95% CI 1.35 to 1.97, p<0.01) and multivariate analysis (HR=1.61, 95% CI 1.26 to 2.06, p<0.01). In contrast, the two groups showed similar DFS in univariate analysis (HR=1.49, 95% CI 0.73 to 3.01, p=0.27) as well as similar RFS in univariate analysis (HR=1.44, 95% CI 0.65 to 3.17, p=0.37) and multivariate analysis (HR=1.02, 95% CI 0.42 to 2.47, p=0.97). Patients with low LKB1 expression showed significantly worse tumour differentiation (OR=1.71, 95% CI 1.14 to 2.55, p<0.01), larger tumours (OR=1.68, 95% CI 1.24 to 2.27, p<0.01), earlier lymph node metastasis (OR=1.43, 95% CI 1.26 to 1.62, p<0.01) and more advanced tumour, node, metastases (TNM) stage (OR=1.80, 95% CI 1.56 to 2.07, p<0.01).
Conclusion
Low LKB1 expression predicts shorter OS, worse tumour differentiation, larger tumours, earlier lymph node metastasis and more advanced TNM stage. Low LKB1 expression may be a useful biomarker of poor clinicopathology and prognosis.
Keywords: Lkb1, Stk11, liver kinase B1, prognosis
Strengths and limitations of this study.
This review included large sample size to reveal the relationship between the expression of liver kinase B1 (LKB1) and solid tumours.
Subgroup analyses and sensitivity analyses were performed to confirm the findings.
The cut-off value of LKB1 among the included studies were inconsistent.
Introduction
The serine/threonine kinase liver kinase B1 (LKB1), also known as STK11, was originally observed to be mutated in the genes of patients with Peutz-Jeghers syndrome.1 LKB1 is often mutated in lung, breast, gastric and other cancers.2–4 LKB1 plays key roles in multiple cellular processes, including cell structure control, cell cycle regulation, apoptosis and cellular metabolism.5–7 LKB1 phosphorylates multiple substrates, including AMPK, to act as a tumour suppressor to restrict tumourigenesis and metastasis.8 Mice with a regulatory T cell (Treg)-specific deletion of LKB1 develop a fatal inflammatory disease, and LKB1 in Treg cells acts not through signalling by AMPK or the mammalian target of rapamycin complex 1 (mTORC1) and hypoxia-inducible factor 1, but through signalling involving programmed cell death protein 1 and TNF receptor proteins.9 LKB1 deficiency can render tumour cells sensitive to metabolic stress, which may turn out to be an antitumour strategy.10
Although several studies have examined the role of LKB1 in tumour inhibition, its role in the prognosis of solid tumours has not been conclusively determined. Several studies suggest that decreased LKB1 expression indicates poor prognosis. In fact, meta-analysis showed that decreased LKB1 expression in patients with solid tumours may be related to poor prognosis and serve as a predictor of clinicopathological prognostic factors.11 However, other studies have not reproduced these findings, and some have even suggested that decreased LKB1 may correlate with favourable survival.
Therefore, we systematically reviewed and meta-analysed the relevant literature to understand the current evidence about a relationship between LKB1 expression and prognosis in patients with solid tumours.
Materials and methods
Literature search strategy
The following databases were searched from database establishment to 15 June 2018 to identify studies of LKB1 expression and survival in solid tumours: PubMed, Embase, Web of Science, Cochrane Database, the Chinese National Knowledge Infrastructure and Wang Fang. Searches were carried out using terms such as LKB1, STK11, liver kinase B1, prognosis, prognostic, survival and overall survival. For example, we searched PubMed using the following strategy: (LKB1(tw) OR STK11(tw) OR ‘liver kinase B1’(tw) OR ‘serine-threonine kinase 11’(tw)) AND (‘prognosis’ (MeSH terms) OR prognoses(tw) OR prognostic(tw) OR ‘prognostic factor’(tw) OR ‘prognostic factors’(tw) OR factor(tw) OR factors(tw) OR outcome(tw) OR survival(tw) OR metastases(tw) OR metastasis(tw) OR migration(tw) OR transplantation(tw) OR transfer(tw) OR shift(tw) OR divert(tw) OR recurrence(tw) OR relapse(tw) OR reappear(tw) OR recur(tw) OR recidivation(tw) OR invasion(tw)).
Study inclusion and exclusion criteria
Studies were considered eligible if they met the following criteria: (1) LKB1 expression in cancer tissue (obtained via surgery or biopsy) was measured by immunohistochemistry or western blot analysis; (2) the association was studied between LKB1 expression and clinicopathological characteristics, overall survival (OS), disease-free survival (DFS) or recurrence-free survival (RFS) of patients with solid tumours; (3) sufficient data were published for calculating an OR or HR and 95% CI and (4) the study was published as a full-text article in English or Chinese. If we retrieved multiple studies conducted by the same research group and involving overlapping patient populations, only the most recent or most complete study was included in the meta-analysis. Articles were excluded if they (1) were duplicate publications; (2) were case reports, reviews, letters or animal studies or (3) did not report survival outcomes.
Study quality assessment
Two reviewers independently assessed the quality of included studies using the standard Newcastle-Ottawa Scale (NOS) from 0 to 9. NOS scores of 9–7 were defined as high quality, 6–4 as intermediate quality and 3–1 as low quality.
Data extraction
Two researchers (YHR and FJZ) independently screened all titles and abstracts identified in the initial search. Articles remaining after this screen were read in full and assessed for eligibility. The following types of data were extracted: (1) name of first author, publication year, country, type of cancer and number of patients; (2) patient’s age, gender, follow-up time, type of LKB1 assay, intracellular location where LKB1 staining was examined, LKB1 cut-off value for classifying expression as high or low, survival data (OS, DFS, RFS), statistical method used to analyse survival data; (3) tumour differentiation, tumour size, lymph node metastasis and tumour stage. All data were cross-checked by two researchers, and disagreements were resolved by a third reviewer (XMY). If study information was incomplete or unclear, we contacted the corresponding author in an attempt to collect accurate information.
Statistical analysis
Correlation between LKB1 expression and OS of patients with solid tumours was evaluated in terms of HR and 95% CI. If a study showed Kaplan-Meier survival curves but not HRs with 95% CI, data were extracted from survival curves using Engauge Digitizer 4.1 and the Tierney’s table. Correlation between LKB1 expression and clinicopathological characteristics of patients with solid tumours was evaluated in terms of OR and 95% CI.
HRs and ORs were meta-analysed using the random-effects model in R software. P values were two-sided and values <0.05 were considered to be statistically significant.
I² was used to assess statistical heterogeneity. If I² was >50%, heterogeneity was considered to exist among all included studies, and we conducted a subgroup analysis to investigate its possible source. If I² was <50%, heterogeneity among all included studies was regarded as insignificant, and data were directly pooled.
To assess the stability of our meta-analysis results, we conducted a sensitivity analysis to test the influences of individual studies on the pooled HR or p value for the remaining studies. Potential for publication bias was assessed by examining funnel plots, Begg’s test and Egger’s test of survival data.
Results
A total of 4858 potentially relevant studies were identified in literature searches, of which 3374 were excluded as duplicate publications. After screening titles and abstracts, 50 studies were read in full, leading to 25 that were included in the meta-analysis12–36 (figure 1). Data from all 25 studies were meta-analysed to examine the potential correlation of LKB1 expression with clinicopathological characteristics. Data from 24 studies were meta-analysed to examine the potential correlation between LKB1 expression and OS. Data from five studies were used to analyse the potential correlation between LKB1 expression and DFS. Four studies reported the association of LKB1 expression with RFS.
Figure 1.
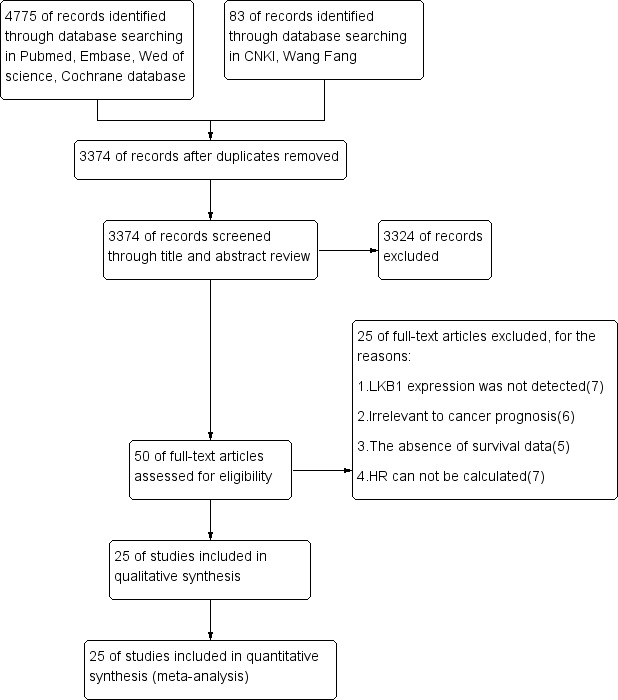
Flow diagram of the eligible studies. CNKI, Chinese National Knowledge Infrastructure; LKB1, liver kinase B1.
Description of studies
The 25 studies in the systematic review involved 6012 patients from six countries: China, the USA, France, the UK, Canada and Egypt. Data on OS were reported in 24 studies, data on RFS in 5 studies and data on DFS in 4 studies. Patients covered a range of cancers, including cancers of the lung, breast, prostate or pancreas; gastric cancer; hepatocellular carcinoma; oesophagus squamous cancer; colorectal cancer; glioma and laryngeal squamous cell carcinoma. Tables 1–2 summarise the characteristics of the included studies. Online supplementary table 1 lists clinicopathological characteristics and LKB1 expression. Eight studies had a NOS score of 8; 11 studies, 7; 6 studies, 6 and 3 studies, 5 (online supplementary table 2 and online supplementary table 3).
Table 1.
Main characteristics of included studies and Newcastle-Ottawa Scale (NOS) scores
| Study | Year | Country | Type of cancer | No. of cases | Age (years), median (range) | Follow-up, mo. | NOS score | |
| Low LKB1 | High LKB1 | |||||||
| Ding XM12 | 2005 | China | Lung adenocarcinoma | 24 | 38 | 60.5 (32–77) | 80 | 7 |
| Tsai LH13 | 2013 | China | Lung adenocarcinoma | 44 | 71 | NR | 140 | 7 |
| Jiang LL et al 14 | 2014 | China | Non-small cell lung cancer | 33 | 109 | 58.2 (31–84) | 71 | 7 |
| Calles A et al 15 | 2015 | USA | Lung adenocarcinoma | 42 | 84 | 63.5 (30–84) | 60 | 7 |
| Shen Z et al 16 | 2002 | China | Breast carcinoma | 38 | 83 | 53.7 (32–77) | 70 | 6 |
| Bouchekioua-Bouzaghou K et al 17 | 2014 | France | Breast cancer | 94 | 60 | 56.87 (27–87) | 162 | 7 |
| Bouchekioua-Bouzaghou K et al 17 | 2014 | France | Breast cancer | 102 | 52 | 56.5 (27–87) | 162 | |
| Chen IC et al 18 | 2016 | China | Breast cancer | 161 | 408 | 48 | 120 | 6 |
| Chen IC et al 18 | 2016 | China | Breast cancer | 88 | 189 | 54 | 120 | |
| Chen IC et al 18 | 2016 | UK and Canada | Breast cancer | 494 | 494 | 61.3 | 300 | 5 |
| Chen IC et al 18 | 2016 | UK and Canada | Breast cancer | 488 | 487 | 62.6 | 300 | |
| HamdyA.Azim et al 19 | 2016 | Egypt | Breast cancer | 12 | 20 | 51.3 (25–82) | 82.8 | 6 |
| HamdyA.Azim et al 19 | 2016 | Egypt | Breast cancer | 11 | 21 | 51.3 (25–82) | 82.8 | |
| Morton JP et al 20 | 2010 | UK | Pancreatic cancer | 20 | 86 | NR | 95 | 7 |
| Yang JY et al 21 | 2015 | China | Pancreatic ductal adenocarcinoma | 36 | 169 | NR | 97 | 8 |
| Li DZ et al 23 | 2018 | China | Pancreatic neuroendocrine tumour | 38 | 33 | NR | 190 | 8 |
| Yang XW et al 22 | 2012 | China | Gastric cancer | 76 | 24 | 65 (31–85) | 38 | 7 |
| Huang Y et al 24 | 2014 | China | Gastric carcinoma | 24 | 91 | 61 (37–80) | 75 | 6 |
| Ma LG et al 25 | 2016 | China | Gastric cancer | 62 | 47 | 57 (31–84) | 99 | 8 |
| Sun JJ et al 36 | 2016 | China | Gastric cancer | 107 | 48 | NR | 70 | 6 |
| Yin M et al 26 | 2017 | China | Gastric cancer | 78 | 32 | 62 (23–79) | 72 | 7 |
| Huang YH et al 27 | 2013 | China | Hepatocellular carcinoma | 31 | 39 | 57 (43–72) | 68 | 7 |
| Lee SW et al 28 | 2015 | China | Hepatocellular carcinoma | 13 | 27 | NR | 101 | 7 |
| Wu CC et al 29 | 2018 | China | Hepatocellular carcinoma | 41 | 52 | NR | 54 | 7 |
| Wang JH30 | 2015 | China | Intrahepatic cholangiocarcinoma | 187 | 129 | NR | 99 | 8 |
| Ma JJ | 2014 | China | Oesophagus squamous cancer | 73 | 47 | NR | 60 | 8 |
| He TY et al 32 | 2014 | China | Colorectal cancer | 63 | 95 | NR | 80.5 | 5 |
| Lu JL et al 33 | 2015 | China | Prostate cancer | 78 | 31 | NR | 60 | 7 |
| Huang JH et al 27 | 2017 | China | Glioma | 92 | 88 | 50.8 (10–86) | 118 | 8 |
| He SS et al 35 | 2017 | China | Laryngeal squamous cell carcinoma | 128 | 80 | NR | 212.2 | 8 |
LKB1, liver kinase B1; NR, no resources.
Table 2.
LKB1 expression levels and survival
| Study | Assay method | Staining location | Cut-off value | Outcome | Analysis method | HR and 95% CI |
| Ding XM12 | IHC | Both nucleus and cytoplasm | Lower than in normal airway epithelium | OS | UA | 3.003 (1.524 to 5.865) |
| Tsai LH et al 13 | IHC | No specific description | Score ≤100 | OS | UA | 1.846 (1.147 to 2.952) |
| MA | 1.868 (1.160 to 3.007) | |||||
| RFS | UA | 1.828 (1.247 to 3.122) | ||||
| MA | 1.791 (1.132 to 2.834) | |||||
| Jiang LL et al 14 | IHC | Cytoplasm | Score 0–4 | OS | UA | 3.226 (1.856 to 5.586) |
| MA | 2.128 (1.136 to 4.000) | |||||
| Calles A et al 15 | IHC | Cytoplasm | No staining | OS | UA | 1.440 (0.910 to 2.270) |
| ShenZ et al 16 | WB | Total protein | Bands of the breast cancer tissue in which the quantities were <0.5 | OS | UA | 3.754 (1.583 to 8.932) |
| DFS | UA | 2.529 (1.383 to 5.933) | ||||
| Bouchekioua-Bouzaghou K et al 17 | IHC | Cytoplasm | Staining intensity recorded as 0–1 | OS | UA | 0.418 (0.211 to 0.828) |
| MA | 0.403 (0.199 to 0.820) | |||||
| DFS | UA | 0.495 (0.249 to 0.809) | ||||
| MA | 0.549 (0.303 to 0.990) | |||||
| Bouchekioua-Bouzaghou K et al 17 | IHC | Nucleus | Staining intensity recorded as 0 | OS | UA | 1.417 (0.722 to 2.734) |
| DFS | UA | 1.278 (0.732 to 2.225) | ||||
| Chen IC et al 18 | IHC | No specific description | Score 0 or 1 | OS | UA | 1.200 (0.670 to 2.150) |
| MA | 0.766 (0.453 to 1.296) | |||||
| Chen IC et al 18 | IHC | No specific description | Score 0 or 1 | OS | UA | 0.980 (0.600 to 1.610) |
| MA | 1.054 (0.665 to 1.671) | |||||
| Chen IC et al 18 | Microarray data | No specific description | Lower than the median expression level | OS | UA | 1.600 (1.360 to 1.894) |
| MA | 0.937 (0.772 to 1.138) | |||||
| Chen IC et al 18 | Microarray data | No specific description | Lower than the median expression level | OS | UA | 1.090 (0.910 to 1.300) |
| MA | 1.024 (0.839 to 1.250) | |||||
| HamdyA.Azim et al 19 | IHC | Cytoplasm | Staining intensity recorded as 0 | RFS | UA | 1.110 (0.160 to 7.490) |
| MA | 0.810 (0.220 to 3.030) | |||||
| HamdyA.Azim et al 19 | IHC | Nucleus | Staining intensity recorded as 0 | RFS | UA | 5.220 (0.23 to 118.460) |
| MA | 0.360 (0.150 to 0.100) | |||||
| Morton JP et al 20 | IHC | Cytoplasm | Histoscore ≤100 | OS | UA | 1.877 (1.020 to 3.448) |
| MA | 1.870 (1.090 to 3.220) | |||||
| Yang JY et al 21 | IHC | No specific description | Total score <4 | OS | UA | 2.278 (1.495 to 3.472) |
| MA | 1.845 (1.189 to 2.856) | |||||
| Li DZ et al 23 | IHC | Cytoplasm | Strong immunostaining in ≤50% of the cells and/or weak staining | OS | UA | 5.310 (0.200 to 142.482) |
| DFS | UA | 2.190 (0.410 to 11.700) | ||||
| Yang XW22 | IHC | Both nucleus and cytoplasm | Staining intensity in the neoplasm less than that in normal mucosa | OS | UA | 2.558 (1.554 to 4.233) |
| Huang Y et al 24 | IHC | Both nucleus and cytoplasm | Staining intensity recorded as 0–1 | OS | UA | 2.514 (1.260 to 5.022) |
| Ma LG et al 25 | IHC | Both nucleus and cytoplasm | Scores ≤1 | OS | UA | 2.310 (1.250 to 4.270) |
| MA | 3.527 (1.491 to 10.630) | |||||
| Sun JJ et al 36 | IHC | Both nucleus and cytoplasm | Scores of 0 and 1+ indicate negative result | OS | UA | 1.450 (0.540 to 3.900) |
| MA | 4.431 (1.363 to 14.407) | |||||
| Yin M et al 26 | IHC | Both nucleus and cytoplasm | Staining intensity recorded as 0–1 | OS | UA | 1.070 (0.460 to 2.470) |
| Huang YH et al 27 | IHC | Cytoplasm | Staining index score ≤3 | OS | UA | 3.155 (1.603 to 6.211) |
| MA | 2.179 (1.066 to 4.44) | |||||
| DFS | UA | 2.737 (1.629 to 6.271) | ||||
| Lee SW et al 28 | IHC | Both nucleus and cytoplasm | H-score was lower than the median | OS | UA | 0.517 (0.284 to 0.931) |
| MA | 0.333 (0.193 to 0.564) | |||||
| Wu CC et al 29 | IHC | No specific description | Histoscore ≤150 | OS | UA | 3.130 (0.910 to 10.840) |
| MA | 4.260 (1.870 to 9.690) | |||||
| RFS | UA | 2.020 (0.870 to 4.720) | ||||
| MA | 2.050 (1.110 to 3.810) | |||||
| Wang JH30 | IHC | Cytoplasm | Staining density lower than the median value | OS | UA | 1.857 (1.438 to 2.386) |
| MA | 1.824 (1.404 to 2.377) | |||||
| Ma JJ et al 25 | IHC | Both nucleus and cytoplasm | Score 0–4 | OS | UA | 0.570 (0.330 to 0.980) |
| He TY et al 32 | IHC | No specific description | Score ≤100 | OS | UA | 2.364 (1.466 to 3.812) |
| MA | 3.146 (1.876 to 5.276) | |||||
| RFS | UA | 2.522 (1.701 to 4.445) | ||||
| MA | 3.093 (1.843 to 5.191) | |||||
| Lu JL et al 33 | IHC | No specific description | Staining of fewer than 20% of the tissue cells or no staining | OS | UA | 6.310 (0.420 to 94.730) |
| MA | 3.981 (1.698 to 9.336) | |||||
| Huang JH et al 34 | IHC | No specific description | Percentage of positive cells ≤35% and/or staining intensity score 0–1 | OS | UA | 3.350 (1.490 to 7.510) |
| MA | 3.022 (1.002 to 6.016) | |||||
| He SS et al 35 | IHC | Nucleus | Score ≤4 | OS | UA | 1.170 (0.720 to 1.900) |
| MA | 1.628 (1.060 to 2.500) |
DFS, disease-free survival; IHC, immunohistochemistry; LKB1, liver kinase B1; MA, multivariate analysis; OS, overall survival; RFS, relapse-free survival; UA, univariate analysis; WB, western blot.
bmjopen-2018-027185supp001.pdf (106.4KB, pdf)
bmjopen-2018-027185supp002.pdf (70.7KB, pdf)
bmjopen-2018-027185supp003.pdf (72.7KB, pdf)
Of the 25 studies, 16 reported HRs from multivariate analysis, which we used directly. For the nine remaining studies, we estimated HRs for OS, DFS and RFS from survival curves and Tierney’s table.
Association between LKB1 expression and OS
Given heterogeneity among the studies (I²=74.0%, p<0.001), a random-effects model was used to meta-analyse the data. The pooled HR describing OS for patients with low LKB1 expression relative to OS for patients with high expression is shown in figure 2. Decreased LKB1 expression was significantly associated with OS: low expression was associated with significantly higher risk of poor survival (HR=1.63, 95% CI 1.35 to 1.97, p<0.01).
Figure 2.
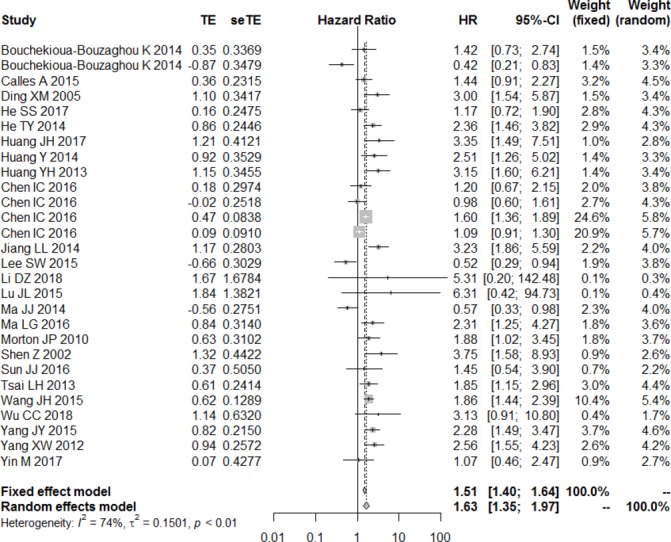
Forest plot of the association between decrease liver kinase B1 expression and overall survival.
To assess the predictive role of decreased LKB1, subgroup analysis was performed after stratifying the results based on multivariate analysis, type of LKB1 assay, country, cancer type and intracellular location of LKB1 staining that was examined. Subgroup analysis based on multivariate analysis showed that decreased LKB1 expression was related to poor OS in table 3 (HR=1.61, 95% CI 1.26 to 2.06, p<0.001 with significant heterogeneity). This relationship was observed for the following cancer types: lung cancer (HR=2.07, 95% CI 1.60 to 2.69, p<0.01, I²=0%), pancreatic cancer (HR=2.16, 95% CI 1.53 to 3.05, p<0.001, I²=0%), gastric cancer (HR=2.11, 95% CI 1.60 to 3.01, p<0.01, I²=0%) and breast cancer (HR=1.26, 95% CI 1.15 to 1.37, p<0.01). However, this relationship was not observed in the case of hepatocellular carcinoma (HR=1.27, 95% CI 0.84 to 1.94, p=0.26 with significant heterogeneity).
Table 3.
Subgroup analyses of the association between LKB1 expression and OS after stratification by statistical analysis method, LKB1 assay method, region, cancer type and intracellular staining location
| Stratification criterion | Value | HR (95% CI) | P value | Heterogeneity | |
| I² | P value | ||||
| Analysis method | Univariate | 1.63 (1.35 to 1.97) | <0.001 | 74% | <0.001 |
| Multivariate | 1.61 (1.26 to 2.06) | <0.001 | 81% | <0.001 | |
| Assay method | IHC | 1.58 (1.33 to 1.88) | <0.001 | 76% | <0.001 |
| Region | Asian | 1.70 (1.42 to 2.05) | <0.001 | 77% | <0.001 |
| Not Asian | 1.15 (0.63 to 2.08) | 0.65 | 75% | 0.007 | |
| Cancer type | Lung | 2.07 (1.60 to 2.69) | <0.001 | 53% | 0.09 |
| Breast | 1.26 (1.15 to 1.37) | <0.001 | 79% | <0.001 | |
| Gastric | 2.11 (1.60 to 3.01) | <0.001 | 0% | 0.41 | |
| Pancreatic | 2.16 (1.53 to 3.05) | <0.001 | 0% | 0.76 | |
| Hepatocellular carcinoma | 1.27 (0.84 to 1.94) | 0.26 | 89% | <0.001 | |
| Others | 1.63 (1.35 to 1.96) | <0.001 | 79% | <0.001 | |
| Staining position | Both nucleus and cytoplasm | 1.50 (1.31 to 1.17) | <0.001 | 80% | <0.001 |
| Cytoplasm | 1.78 (1.49 to 2.13) | <0.001 | 77% | <0.001 | |
| Nucleus | 1.25 (0.85 to 1.85) | 0.26 | 0% | 0.65 | |
| Others | 1.36 (1.25 to 1.47) | <0.001 | 75% | <0.001 | |
| NOS scores | High quality | 1.53 (1.19 to 1.96) | <0.001 | 77% | <0.001 |
| Intermediate quality | 1.79 (1.36 to 1.92) | <0.001 | 75% | <0.001 | |
IHC, immunohistochemistry; LKB1, liver kinase B1; NOS, Newcastle-Ottawa Scale; OS, overall survival; RFS, relapse-free survival.
Among Asian patients, decreased LKB1 expression was associated with significantly shorter OS (HR=1.70, 95% CI 1.42 to 2.05, p<0.01); this relationship was not observed among non-Asian patients (HR=1.15, 95% CI 0.63 to 2.08, p=0.65) (table 3).
Pooled HR for the subgroup of patients tested by anti-LKB1 immunohistochemistry was 1.58 (95% CI 1.33 to 1.88, p<0.01). Low LKB1 expression based on cytoplasmic staining predicted significant adverse prognosis (HR=1.78, 95% CI 1.49 to 2.13, p<0.01). This relationship was not observed when the judgement of low LKB1 expression was based on nuclear staining (HR=1.25, 95% CI 0.85 to 1.85, p=0.26, I²=0%) (table 3).
Details of the subgroup analysis are listed in table 3. The results of the sensitivity analysis showed that the exclusion of each single study did not alter the results significantly (figure 3). These results suggest that our meta-analysis gave credible results.
Figure 3.
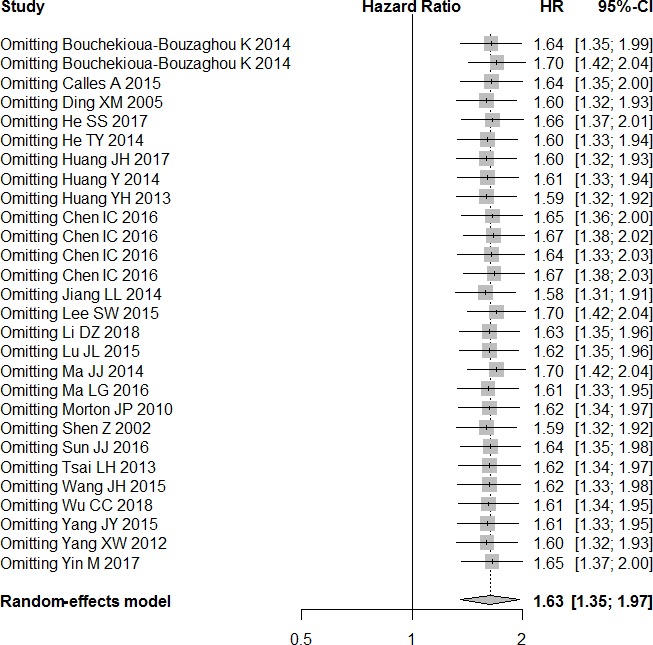
Sensitivity analysis of overall survival in the meta-analysis.
Association of LKB1 expression with DFS and RFS
Studies showed significant heterogeneity, so data were meta-analysed using a random-effects model. Low LKB1 expression did not show a significant association with RFS based on univariate analysis (HR=1.44, 95% CI 0.65 to 3.17, p=0.37) or multivariate analysis (HR=1.02, 95% CI 0.42 to 2.47, p=0.97). Similarly, no significant correlation was observed between LKB1 expression and DFS based on univariate analysis and random-effects meta-analysis (HR=1.49, 95% CI 0.73 to 3.01, p=0.27) (table 4).
Table 4.
Meta-analysis results of decreased LKB1 expression and patient’s prognosis
| Prognosis | Analysis method | HR (95% CI) | P value | Heterogeneity | |
| I² | P value | ||||
| OS | Univariate analysis | 1.63 (1.35 to 1.97) | <0.01 | 74.0% | <0.001 |
| Multivariate analysis | 1.61 (1.26 to 2.06) | <0.001 | 81.0% | <0.001 | |
| RFS | Univariate analysis | 1.44 (0.65 to 3.17) | 0.37 | 85% | <0.001 |
| Multivariate analysis | 1.02 (0.42 to 2.47) | 0.97 | 95% | <0.001 | |
| DFS | Univariate analysis | 1.49 (0.73 to 3.01) | 0.27 | 78% | 0.001 |
DFS, disease-free survival; LKB1, liver kinase B1; OS, overall survival; RFS, relapse-free survival.
Association between LKB1 expression and clinicopathological characteristics
Meta-analysis of the relationship between LKB1 expression and clinicopathological characteristics (table 5) failed to show a significant association of decreased LKB1 expression with age (OR=0.78, 95% CI 0.57 to 1.05, p=0.10) or sex (OR=0.97, 95% CI 0.78 to 1.19, p=0.76). In contrast, low LKB1 expression was significantly related to worse differentiation (OR=1.17, 95% CI 1.14 to 2.55, p<0.01), deeper invasion (OR=1.68, 95% CI 1.24 to 2.27, p<0.01), earlier lymph node metastasis (OR=1.43, 95% CI 1.26 to 1.62, p<0.01) and more advanced clinical stage (OR=1.80, 95% CI 1.56 to 2.07, p<0.01).
Table 5.
Meta-analysis of the association of decreased LKB1 expression with clinicopathological characteristics
| OR (95% CI) | P value | Heterogeneity | |||
| Q test | I² | P value | |||
| Age (≥60, <60 years) | 0.78 (0.57 to 1.05) | 0.10 | 4.04 | 0% | 0.78 |
| Sex (male, female) | 0.97 (0.78 to 1.19) | 0.76 | 9.06 | 0% | 0.77 |
| Tumour differentiation (poor, well) | 1.71 (1.14 to 2.55) | <0.01 | 59.5 | 75% | <0.001 |
| Tumour size (T3–T4, T1–T2) | 1.68 (1.24 to 2.27) | <0.01 | 43.34 | 61% | <0.001 |
| Lymph node metastasis (yes, no) | 1.43 (1.26 to 1.62) | <0.01 | 58.41 | 74% | <0.001 |
| TNM stage (Ⅲ–Ⅳ, Ⅰ–Ⅱ) | 1.80 (1.56 to 2.07) | <0.01 | 88.8 | 81% | <0.001 |
LKB1, liver kinase B1; TNM, tumour, node, metastases.
Results are shown as individual and pooled OR with 95% CIs.
Publication bias
Funnel plots of OS appeared asymmetric (figure 4), suggesting the possibility of publication bias among the included studies. However, findings with Begg’s test (p=0.5402) and Egger’s test (p=0.2414) implied no publication bias.
Figure 4.
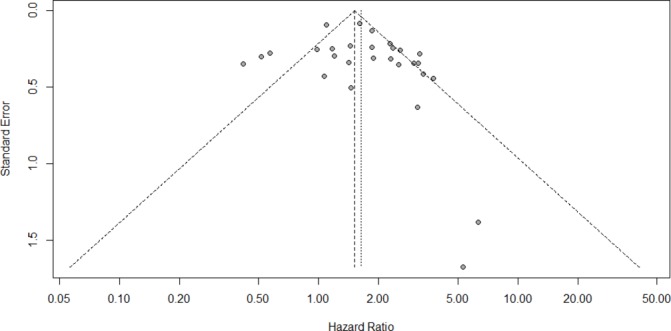
Funnel plot for the potential publication bias.
Discussion
This meta-analysis suggests that among patients with many kinds of solid tumours, low LKB1 expression is associated with worse OS, whereas LKB1 expression does not appear to significantly influence DFS or RFS. This suggests that low LKB1 expression may be a predictor of unfavourable prognosis. In fact, the available evidence suggests an association of low LKB1 expression with worse tumour differentiation, deeper invasion, more advanced clinical stages and earlier metastasis to lymph nodes and other organs. These findings are consistent with previous conclusions,11 and they were confirmed in our data set using sensitivity analysis.
Some potentially interesting findings emerged from subgroup analyses conducted after stratifying the data according to various criteria. Our meta-analysis linked low LKB1 expression with poor prognosis in Asians but not in non-Asians, which may reflect genetic and environmental differences. While low LKB1 expression was associated with worse prognosis in patients with certain types of cancer (lung, gastric, pancreatic, breast), this was not the case in patients with hepatocellular carcinoma. This difference may relate to different comorbidities associated with the types of cancer. Lung cancer, stomach cancer, breast cancer and pancreatic cancer have high incidence rates around the world, and more studies have been done. The association between low expression of LKB1 and poor prognosis was observed when low expression was based on cytoplasmic staining, but not when it was based on nuclear staining. The reason may be that the regulation of mTORC1 by LKB1 and AMPK occurs on the exterior of RAB7/LAMP1-positive lysosomal membranes.37 In this regulation, LKB1 phosphorylates and activates cell energy-sensing AMPK, which in turn negatively affects TORC1, which is important for controlling energy metabolism, cell survival and cell growth under conditions of metabolic stress, such as nutrient deficiency. Further studies are needed to elucidate the mechanism of action of LKB1.
Our meta-analysis suggests that at least in many types of solid tumours, LKB1 acts as a tumour suppressor. This is consistent with several studies in the literature. For example, a decrease in LKB1 expression as a result of HBx-mediated p53 inactivation may be responsible for colony formation and invasiveness in hepatocellular carcinoma.29 LKB1 deficiency in some tumours may be associated with upregulation of glutamate dehydrogenase 1, which activates CamKK2 and its downstream effector AMPK to increase metastatic potential.38 LKB1 loss may drive ovarian serous tumourigenesis by disrupting apical-basal polarity in the presence of mutated p53 in fallopian tube cells.39 On the one hand, several studies have suggested an oncogenic role for LKB1 and AMPK under certain conditions,40 such as when class III phosphatidylinositol-3-OH kinase is inactivated.41 Further work is needed to clarify under what conditions LKB1 acts as a tumourigenic or tumour-suppressing molecule.
The results of our meta-analysis should be interpreted with caution given several limitations. First, we had to assess OS, DFS and/or RFS from Kaplan-Meier survival curves in several studies, such that HRs and 95% CIs were estimated indirectly. Second, studies showed substantial heterogeneity for outcomes, although we did attempt to minimise the effects of such heterogeneity by using a random-effects meta-analysis model, performing subgroup analyses and checking results through sensitivity analysis. Third, there is no consensus on LKB1 cut-off values for defining expression as low or high, which may influence conclusions about correlations and their clinical significance. Fourth, the funnel plots suggest the potential for publication bias. This may reflect the generally observed bias towards publication of positive findings. Fifth, our meta-analysis did not account for numerous other factors that may also affect prognosis, such as comorbidities and treatment history. In most cases, this information was not reported in the included studies.
Our results justify the design of rigorous in vitro and animal studies designed to explore how LKB1 influences the prognosis of various types of solid cancers. Ultimately, this work should be extended through human studies, preferentially randomised controlled trials.
Conclusions
The available evidence links low LKB1 expression with poor prognosis in patients with various types of solid tumours. This suggests that LKB1 may be a biomarker for various cancers. These findings should be verified and extended in human studies, and the mechanisms underlying the association of LKB1 expression and prognosis should be explored.
Supplementary Material
Footnotes
Contributors: XMY and HYM designed the study. FJZ, HYM and RRJ conducted systematic search, searched literature and extracted data. YHR analysed the data. YHR and FJZ wrote the first draft of the article. JT, XHZ, JLW, QQL and RRH contributed significant knowledge content and critical expertise and revisions to the manuscript.
Funding: This work was supported by the Graduate Course Construction Project of Guangxi Medical University (YJSA2017014), the Foundation Ability Enhancement Project for Young Teachers in Guangxi Universities (2018KY0122, 2017KY0098), the Guangxi Natural Science Foundation (2018GXNSFBA138018), the Research and Development Program of Guangxi Science and Technology Department (2017AB45190), the Research and Development of Appropriate Medical and Health Technology Project in Guangxi (S201417-03) and Guangxi Health and Family Planning Commission Chinese Medicine Science and Technology Special Subject (GZLC16-36).
Competing interests: None declared.
Provenance and peer review: Not commissioned; externally peer reviewed.
Data sharing statement: All the data are in the article.
Patient consent for publication: Not required.
References
- 1. Hemminki A. The molecular basis and clinical aspects of Peutz-Jeghers syndrome. Cell Mol Life Sci 1999;55:735–50. 10.1007/s000180050329 [DOI] [PMC free article] [PubMed] [Google Scholar]
- 2. Ji H, Ramsey MR, Hayes DN, et al. LKB1 modulates lung cancer differentiation and metastasis. Nature 2007;448:807–10. 10.1038/nature06030 [DOI] [PubMed] [Google Scholar]
- 3. Zhuang ZG, Di GH, Shen ZZ, et al. Enhanced expression of LKB1 in breast cancer cells attenuates angiogenesis, invasion, and metastatic potential. Mol Cancer Res 2006;4:843–9. 10.1158/1541-7786.MCR-06-0118 [DOI] [PubMed] [Google Scholar]
- 4. Takahashi M, Sakayori M, Takahashi S, et al. A novel germline mutation of the LKB1 gene in a patient with Peutz-Jeghers syndrome with early-onset gastric cancer. J Gastroenterol 2004;39:1210–4. 10.1007/s00535-004-1474-y [DOI] [PubMed] [Google Scholar]
- 5. Amin N, Khan A, St Johnston D, et al. LKB1 regulates polarity remodeling and adherens junction formation in the Drosophila eye. Proc Natl Acad Sci U S A 2009;106:8941–6. 10.1073/pnas.0812469106 [DOI] [PMC free article] [PubMed] [Google Scholar]
- 6. Granot Z, Swisa A, Magenheim J, et al. LKB1 regulates pancreatic beta cell size, polarity, and function. Cell Metab 2009;10:296–308. 10.1016/j.cmet.2009.08.010 [DOI] [PMC free article] [PubMed] [Google Scholar]
- 7. Kullmann L, Krahn MP. Controlling the master-upstream regulation of the tumor suppressor LKB1. Oncogene 2018;37:3045–57. 10.1038/s41388-018-0145-z [DOI] [PubMed] [Google Scholar]
- 8. Shackelford DB, Shaw RJ. The LKB1-AMPK pathway: metabolism and growth control in tumour suppression. Nat Rev Cancer 2009;9:563–75. 10.1038/nrc2676 [DOI] [PMC free article] [PubMed] [Google Scholar]
- 9. Yang K, Blanco DB, Neale G, et al. Homeostatic control of metabolic and functional fitness of Treg cells by LKB1 signalling. Nature 2017;548:602–6. 10.1038/nature23665 [DOI] [PMC free article] [PubMed] [Google Scholar]
- 10. Parker SJ, Svensson RU, Divakaruni AS, et al. LKB1 promotes metabolic flexibility in response to energy stress. Metab Eng 2017;43(Pt B):208–17. 10.1016/j.ymben.2016.12.010 [DOI] [PMC free article] [PubMed] [Google Scholar]
- 11. Xiao J, Zou Y, Chen X, et al. The prognostic value of decreased LKB1 in solid tumors: a meta-analysis. PLoS One 2016;11:e0152674 10.1371/journal.pone.0152674 [DOI] [PMC free article] [PubMed] [Google Scholar]
- 12. Ding XM, Zp L. Expression and clinical significance of LKB1 protein in lung adenocarcinoma tissues. Chin J Cancer Prev T Rea T 2005;12:1281–4. [Google Scholar]
- 13. Tsai LH, Chen PM, Cheng YW, et al. LKB1 loss by alteration of the NKX2-1/p53 pathway promotes tumor malignancy and predicts poor survival and relapse in lung adenocarcinomas. Oncogene 2014;33:3851–60. 10.1038/onc.2013.353 [DOI] [PubMed] [Google Scholar]
- 14. Jiang L, Liang X, Liu M, et al. Reduced expression of liver kinase B1 and Beclin1 is associated with the poor survival of patients with non-small cell lung cancer. Oncol Rep 2014;32:1931–8. 10.3892/or.2014.3432 [DOI] [PubMed] [Google Scholar]
- 15. Calles A, Sholl LM, Rodig SJ, et al. Immunohistochemical Loss of LKB1 Is a Biomarker for More Aggressive Biology in KRAS-Mutant Lung Adenocarcinoma. Clin Cancer Res 2015;21:2851–60. 10.1158/1078-0432.CCR-14-3112 [DOI] [PubMed] [Google Scholar]
- 16. Shen Z, Wen XF, Lan F, et al. The tumor suppressor gene LKB1 is associated with prognosis in human breast carcinoma. Clin Cancer Res 2002;8:2085–90. [PubMed] [Google Scholar]
- 17. Bouchekioua-Bouzaghou K, Poulard C, Rambaud J, et al. LKB1 when associated with methylatedERα is a marker of bad prognosis in breast cancer. Int J Cancer 2014;135:1307–18. 10.1002/ijc.28781 [DOI] [PubMed] [Google Scholar]
- 18. Chen IC, Chang YC, Lu YS, et al. Clinical Relevance of Liver Kinase B1(LKB1) Protein and Gene Expression in Breast Cancer. Sci Rep 2016;6:21374 10.1038/srep21374 [DOI] [PMC free article] [PubMed] [Google Scholar]
- 19. Azim HA, Kassem L, Treilleux I, et al. Analysis of PI3K/mTOR Pathway Biomarkers and Their Prognostic Value in Women with Hormone Receptor-Positive, HER2-Negative Early Breast Cancer. Transl Oncol 2016;9:114–23. 10.1016/j.tranon.2016.01.001 [DOI] [PMC free article] [PubMed] [Google Scholar]
- 20. Morton JP, Jamieson NB, Karim SA, et al. LKB1 haploinsufficiency cooperates with Kras to promote pancreatic cancer through suppression of p21-dependent growth arrest. Gastroenterology 2010;139:586–97. 10.1053/j.gastro.2010.04.055 [DOI] [PMC free article] [PubMed] [Google Scholar]
- 21. Yang JY, Jiang SH, Liu DJ, et al. Decreased LKB1 predicts poor prognosis in Pancreatic Ductal Adenocarcinoma. Sci Rep 2015;5:10575 10.1038/srep10575 [DOI] [PMC free article] [PubMed] [Google Scholar]
- 22. Yang XW, Lin T. Expression of LKB1 protein in gastric cancer tissue and its clinical significance. Chin Arch Gen Surg 2012;6:51–6. [Google Scholar]
- 23. Li D, Zhou Y, Liu Y, et al. Decreased expression of LKB1 predicts poor prognosis in pancreatic neuroendocrine tumor patients undergoing curative resection. Onco Targets Ther 2018;11:1259–65. 10.2147/OTT.S154168 [DOI] [PMC free article] [PubMed] [Google Scholar]
- 24. Huang Y, Xia L, et al. Expression of LKB1 and vascular endothelial growth factor in gastric cancer tissue and its clinical significance. Pract Geriatr 2014;28:734–7. [Google Scholar]
- 25. Ma LG, Bian SB, Cui JX, et al. LKB1 inhibits the proliferation of gastric cancer cells by suppressing the nuclear translocation of Yap and β-catenin. Int J Mol Med 2016;37:1039–48. 10.3892/ijmm.2016.2494 [DOI] [PubMed] [Google Scholar]
- 26. Yin M, Bian SB, et al. Expression and clinical significance of LKB1 and ZEB1 in gastric cancer tissues. Guizhou Med 2017;41:1021–4. [Google Scholar]
- 27. Huang YH, Chen ZK, Huang KT, et al. Decreased expression of LKB1 correlates with poor prognosis in hepatocellular carcinoma patients undergoing hepatectomy. Asian Pac J Cancer Prev 2013;14:1985–8. 10.7314/APJCP.2013.14.3.1985 [DOI] [PubMed] [Google Scholar]
- 28. Lee SW, Li CF, Jin G, et al. Skp2-dependent ubiquitination and activation of LKB1 is essential for cancer cell survival under energy stress. Mol Cell 2015;57:1022–33. 10.1016/j.molcel.2015.01.015 [DOI] [PMC free article] [PubMed] [Google Scholar]
- 29. Wu CC, Wu DW, Lin YY, et al. Hepatitis B virus X protein represses LKB1 expression to promote tumor progression and poor postoperative outcome in hepatocellular carcinoma. Surgery 2018;163:1040–6. 10.1016/j.surg.2017.11.030 [DOI] [PubMed] [Google Scholar]
- 30. Wang J, Zhang K. Underexpression of LKB1 tumor suppressor is associated with enhanced Wnt signaling and malignant characteristics of human intrahepatic cholangiocaricinoma. Oncotarget 2015;6:18906–20. [DOI] [PMC free article] [PubMed] [Google Scholar]
- 31. Jj M, Ym D. Expression and significance of LKB1 protein in esophageal squamous cell carcinoma. Medicine and Philosophy 2014;35:65–8. [Google Scholar]
- 32. He TY, Tsai LH, Huang CC, et al. LKB1 loss at transcriptional level promotes tumor malignancy and poor patient outcomes in colorectal cancer. Ann Surg Oncol 2014;21(Suppl 4):S703–10. 10.1245/s10434-014-3824-1 [DOI] [PubMed] [Google Scholar]
- 33. Lu J, Sun P, Sun B, et al. Low LKB1 Expression Results in Unfavorable Prognosis in Prostate Cancer Patients. Med Sci Monit 2015;21:3722–7. 10.12659/MSM.894847 [DOI] [PMC free article] [PubMed] [Google Scholar]
- 34. Huang J, Chen H, Wei Q, et al. Downregulation of LKB1 promotes tumor progression and predicts unfavorable prognosis in patients with glioma. Oncol Lett 2017;13:1688–94. 10.3892/ol.2017.5631 [DOI] [PMC free article] [PubMed] [Google Scholar]
- 35. He SS, Chen Y, Wang HZ, et al. Loss of LKB1 expression decreases the survival and promotes laryngeal cancer metastasis. J Cancer 2017;8:3548–54. 10.7150/jca.20535 [DOI] [PMC free article] [PubMed] [Google Scholar]
- 36. Sun J, Ling B, Xu X, et al. Decreased Expression of Tumor-suppressor Gene LKB1 Correlates with Poor Prognosis in Human Gastric Cancer. Anticancer Res 2016;36:869–76. [PubMed] [Google Scholar]
- 37. Zhang CS, Jiang B, Li M, et al. The lysosomal v-ATPase-Ragulator complex is a common activator for AMPK and mTORC1, acting as a switch between catabolism and anabolism. Cell Metab 2014;20:526–40. 10.1016/j.cmet.2014.06.014 [DOI] [PubMed] [Google Scholar]
- 38. Jin L, Chun J, Pan C, et al. The PLAG1-GDH1 axis promotes anoikis resistance and tumor metastasis through CamKK2-AMPK Signaling in LKB1-Deficient Lung Cancer. Mol Cell 2018;69:87–99. 10.1016/j.molcel.2017.11.025 [DOI] [PMC free article] [PubMed] [Google Scholar]
- 39. George SH, Milea A, Sowamber R, et al. Loss of LKB1 and p53 synergizes to alter fallopian tube epithelial phenotype and high-grade serous tumorigenesis. Oncogene 2016;35:59–68. 10.1038/onc.2015.62 [DOI] [PubMed] [Google Scholar]
- 40. Hardie DG, Alessi DR. LKB1 and AMPK and the cancer-metabolism link - ten years after. BMC Biol 2013;11:36 10.1186/1741-7007-11-36 [DOI] [PMC free article] [PubMed] [Google Scholar]
- 41. O’Farrell F, Lobert VH, Sneeggen M, et al. Class III phosphatidylinositol-3-OH kinase controls epithelial integrity through endosomal LKB1 regulation. Nat Cell Biol 2017;19:1412–23. 10.1038/ncb3631 [DOI] [PubMed] [Google Scholar]
Associated Data
This section collects any data citations, data availability statements, or supplementary materials included in this article.
Supplementary Materials
bmjopen-2018-027185supp001.pdf (106.4KB, pdf)
bmjopen-2018-027185supp002.pdf (70.7KB, pdf)
bmjopen-2018-027185supp003.pdf (72.7KB, pdf)