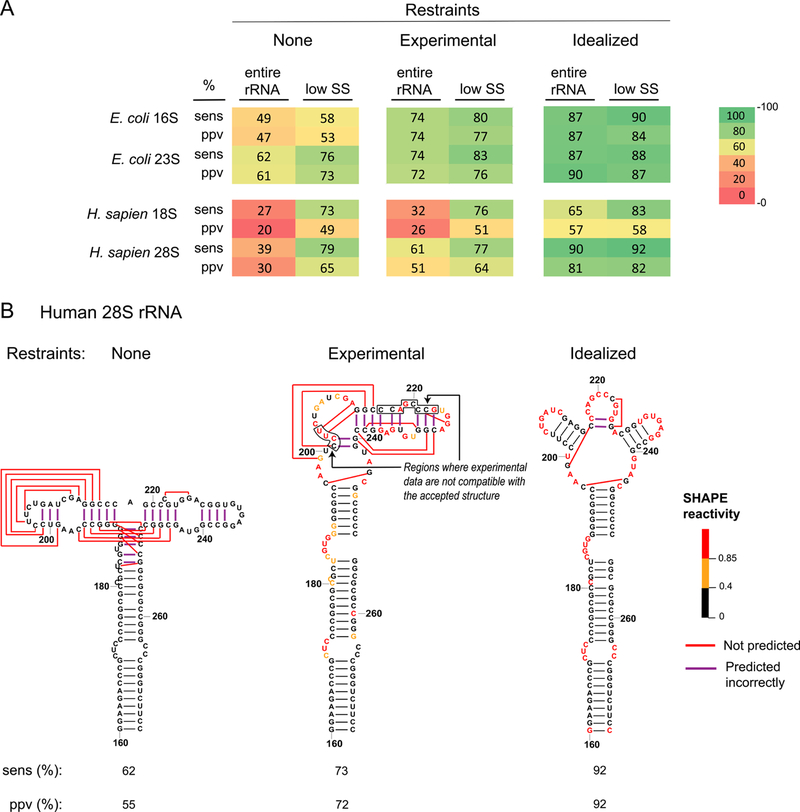
Figure 1. Accuracy of rRNA structure modeling.
(A) Sensitivity (sens) and positive predictive value (ppv) for E. coli and human rRNA structures modeled with no SHAPE data, with restraints from experimental SHAPE data, and with idealized constraints (assigning SHAPE reactivities of zero and one, respectively, to base paired and single stranded nucleotides in the accepted structure). Values for sens and ppv, shown for the entire sequence and for lowSS regions only, are colored from low (red) to high (green). (B) Structure models for the human 28S rRNA, positions 160–275. Nucleotides are colored by SHAPE reactivity constraints used for modeling. This example emphasizes that portions of this RNA, in its protein-free form, fold differently than the accepted structure.

