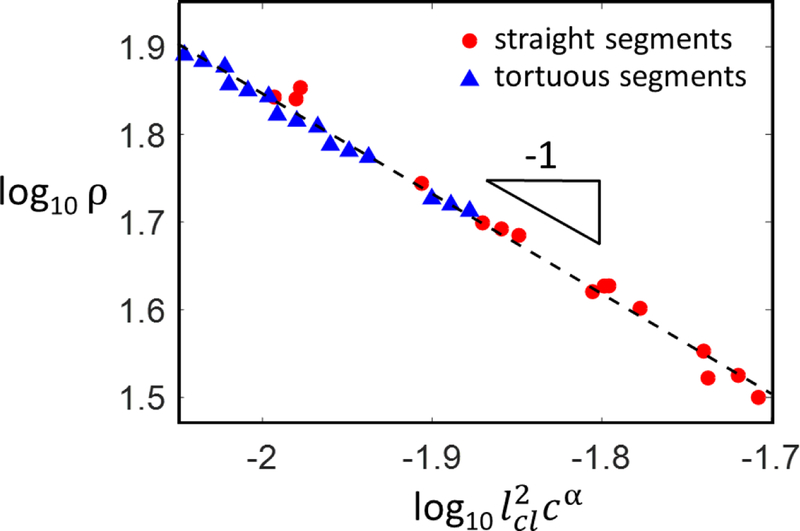
Figure 2:
Variation of network density, ρ, with the mean contour length of fiber segments, lcl and fiber tortuosity, c. The red circles represent networks with no tortuosity, case in which lcl ≡ lc and α = 1. The blue triangles represent cases in which 45% of the fiber segments are tortuous with various values of the tortuosity parameter, c. The exponent leading to data collapse in this particular case is α = 2.3. This value is derived in Appendix A.

