
Figure 7.
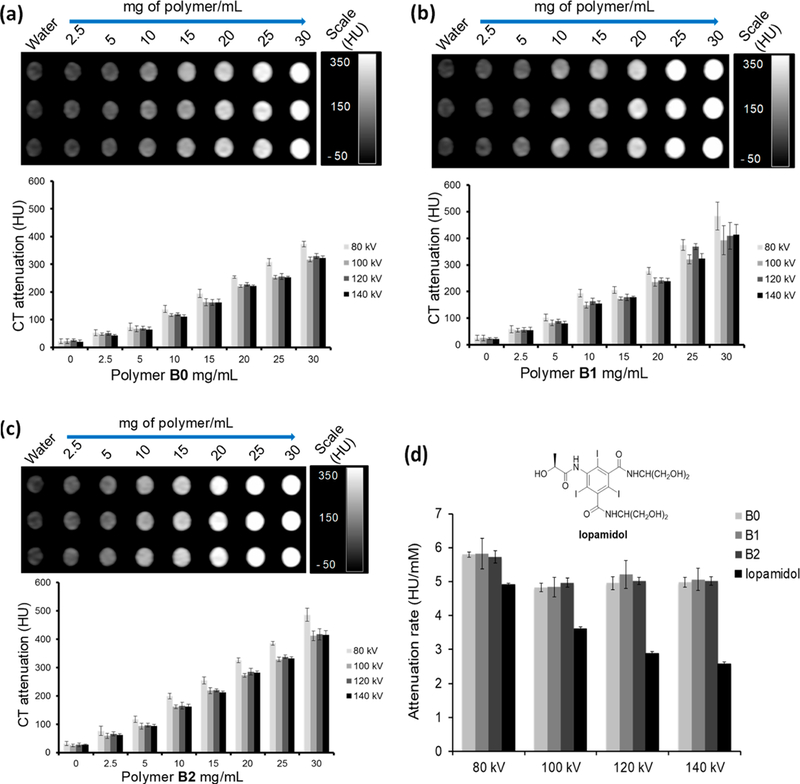
CT attenuation evaluation of B0, B1, and B2: (a) CT image (at 80 kV) of polymer B0 dispersions at concentrations ranging from 2.5 to 30 mg/mL, and a plot showing CT attenuation (HU) vs polymer concentration; (b) CT image and plot for B1 dispersions at the same tube voltage and concentration range; (c) CT image and plot for B2 (same parameters as above); (d) CT contrast properties of polymers B0, B1, and B2 vs Iopamidol.