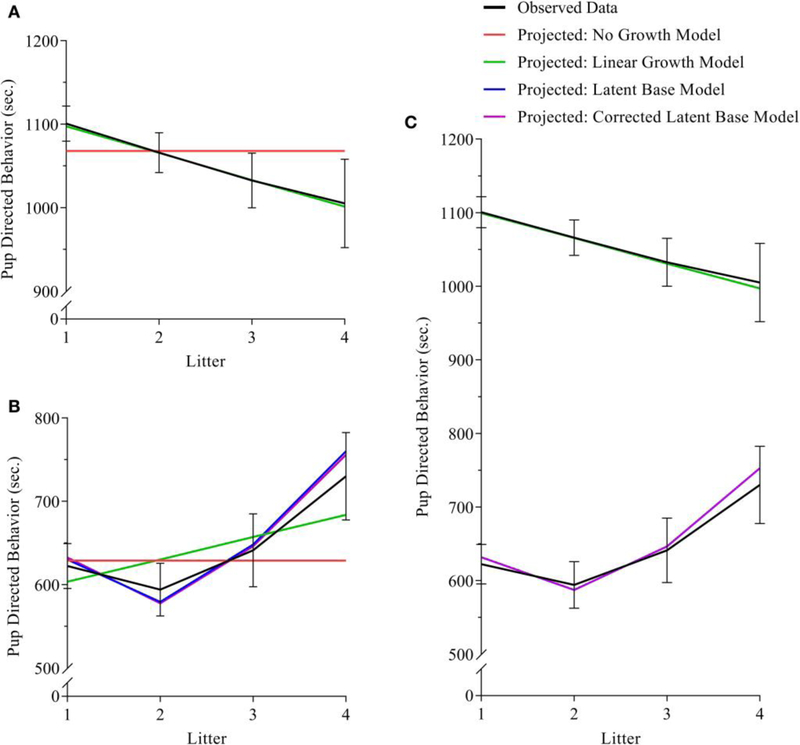
FIGURE 3 |.
(A–C) (A) maternal, (B) paternal, and (C) bivariate dyadic models of pup-directed behavior. In all sub-figures: black lines indicate the plotted means of the sample data; red lines indicated the plotted means of the calculated no-growth model; green lines indicate the plotted means of the calculated linear model; blue and purple lines indicate the plotted means of the uncorrected and corrected latent base models, respectively. In Figure 1C, the black line in the lower half of the figure indicates the means of sample data for fathers, and the black line in the upper half of the figure indicates the means of sample data for mothers. Black error bars represent standard error.

