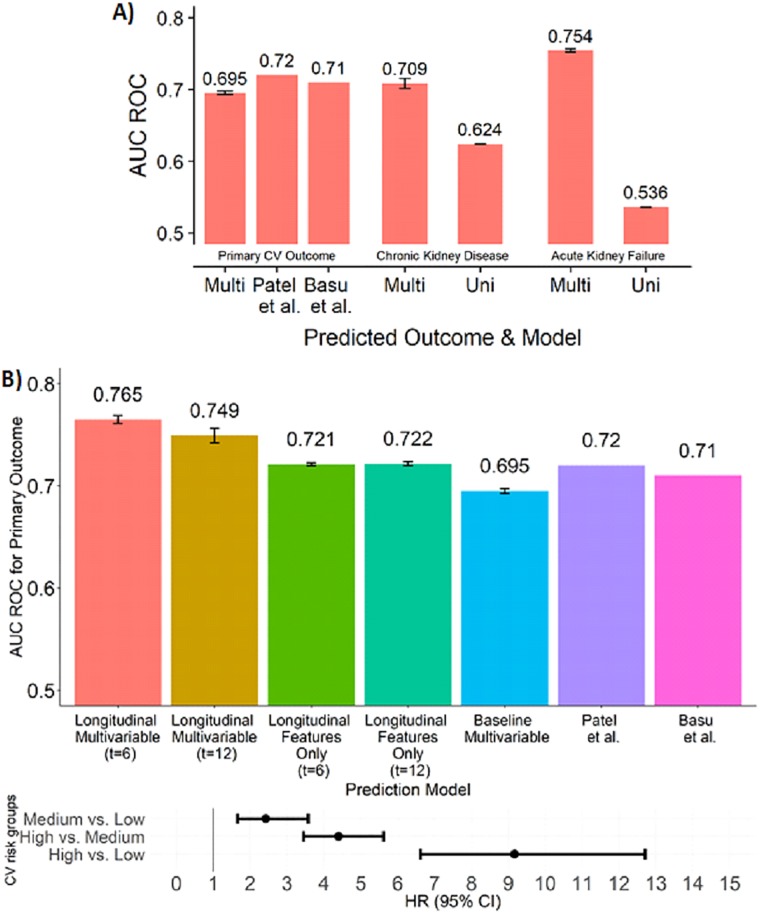
Fig 1. Performance of the predictors on the SPRINT cohort.
A) Performance of baseline predictors in survival analysis (Multi: Multivariable, Uni: Univariate). Results from Basu et al. [9] and Patel et al. [8] were included for CV prediction, but were not available for kidney events. B) Top: Performance of all models in prediction of primary CV outcome (Longitudinal Features Only: a predictive model that utilized the five longitudinal features exclusively, see S1 Table). In A and B results are for 10-fold cross-validation repeated 50 times, with mean and standard errors. Note that sample sizes varied between outcomes in A and between t = 6 and t = 12 in B due to excluded samples. Bottom: Hazard ratio (HR) for different risk groups of SPRINT patients according to the longitudinal model (using t = 6). Patients without sufficient follow-up data (less than three BP measurements up to 6 months prior to censoring/event, n = 435) were excluded. Patients were divided into three equally sized risk groups (high, medium, low) according to their values as predicted by our model, and HR’s were calculated between the groups. HR between the high and low risk groups: 9.171 (6.617–12.710 95% CI); high vs. medium: 4.400 (3.450–5.611 95% CI); medium vs. low: 2.429 (1.653–3.571 95% CI, all HR P-values < 2*10^-16).

