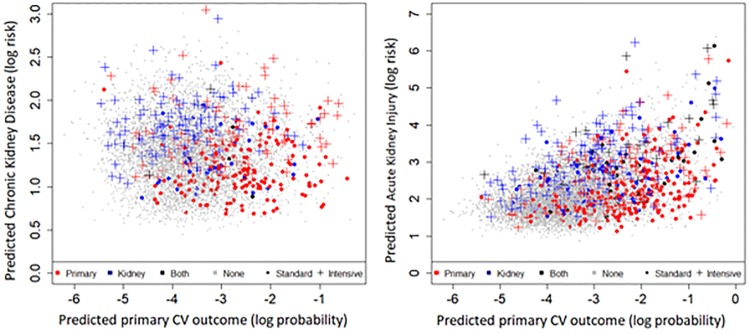
Fig 2. Predictions of the model on all SPRINT participants.
Each spot shows a person’s predictions according to the final longitudinal model with t = 6. X axis: Primary CV outcome. Y axis: CKD or AKI. The point shape and color indicate the events that actually happened and the treatment arm in the SPRINT study for the individual.

