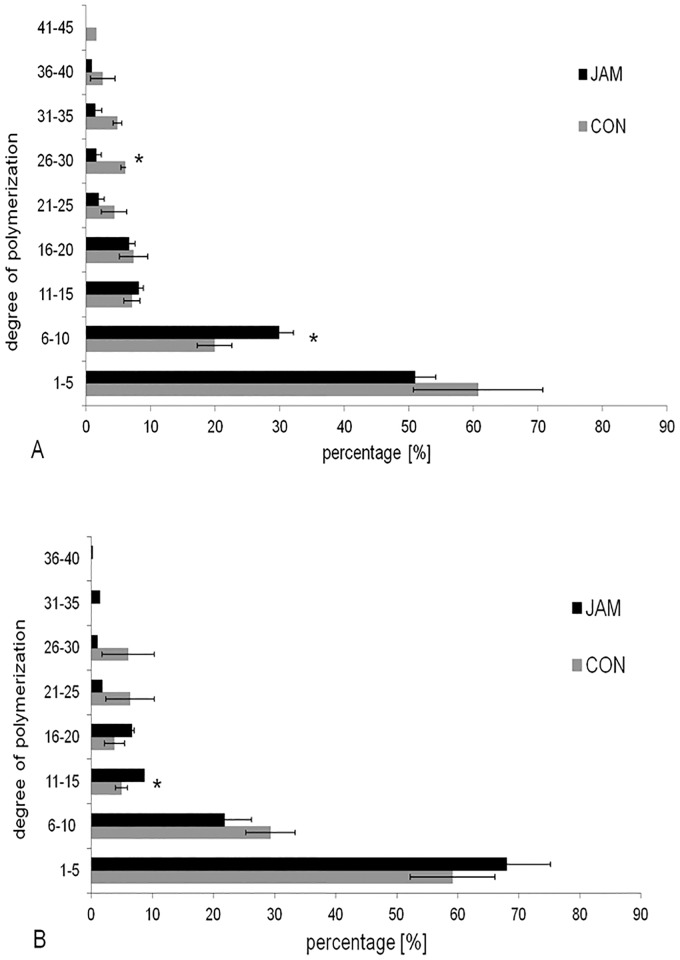
Fig 1. Distribution of the degree of polymerization (%, mean ± SE) in the stomach.
The figure A presents the degree of polymerization in the pars nonglandularis for the CON (placebo) and JAM (Jerusalem artichoke meal) groups. The asterik (*) indicates significant differences (P < 0.05). The figure B presents the degree of polymerization in the pars glandularis for the CON (placebo) and JAM (Jerusalem artichoke meal) groups. The asterik (*) indicates significant differences (P < 0.05).

