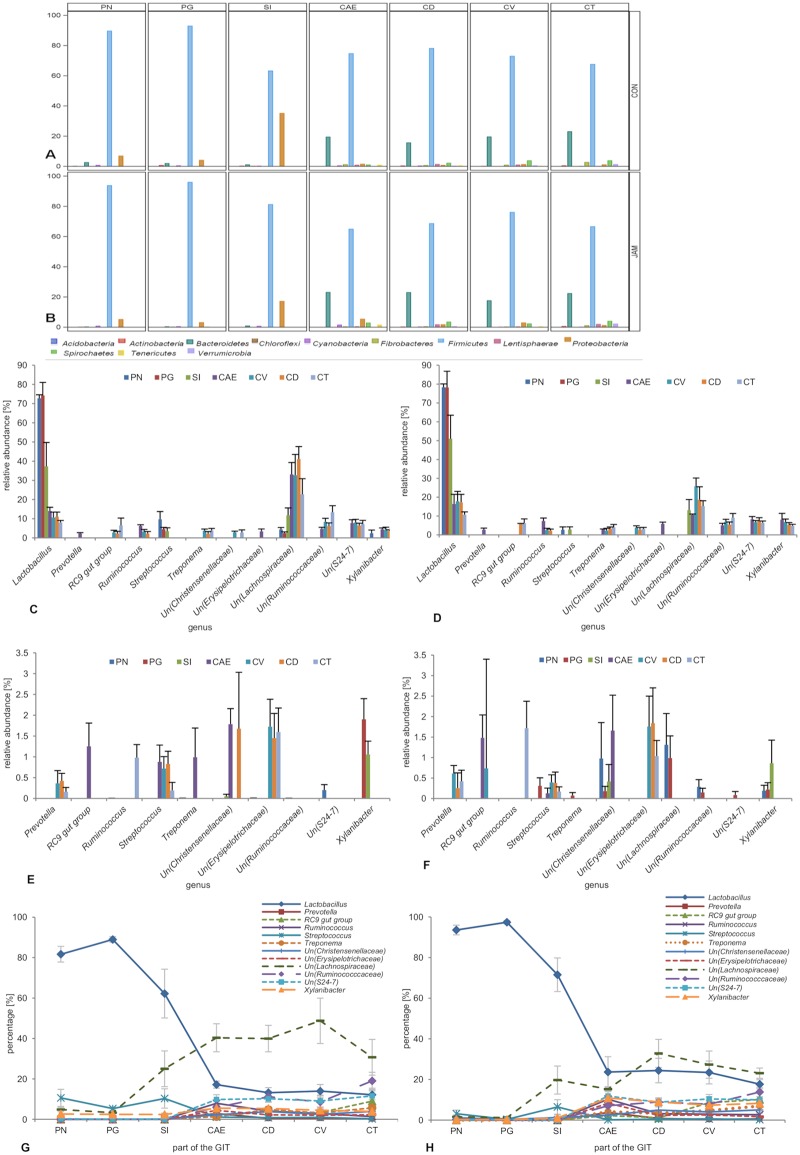
Fig 3. Mean relative abundance (% ± SE) of the different phyla (A–B), the most abundant genera (mean relative abundance ≥ 2%, C-D), rare genera (mean relative abundance < 2%, E-F) and the distribution of the 12 most abundant genera (G-H) along the equine gastrointestinal tract.
The following parts of the digestive tract were examined: CAE (caecum), CD (colon dorsale), CT (colon transversum), CV (colon ventrale), PG (pars glandularis), PN (pars nonglandularis) and SI (small intestine). Figs 3A, 3C, 3E and 3G represent the CON group (placebo). Figs 3B, 3D, 3F and 3H illustrate the JAM group (Jerusalem artichoke meal). Both feeding groups included Un (an unknown member of a specific family).

