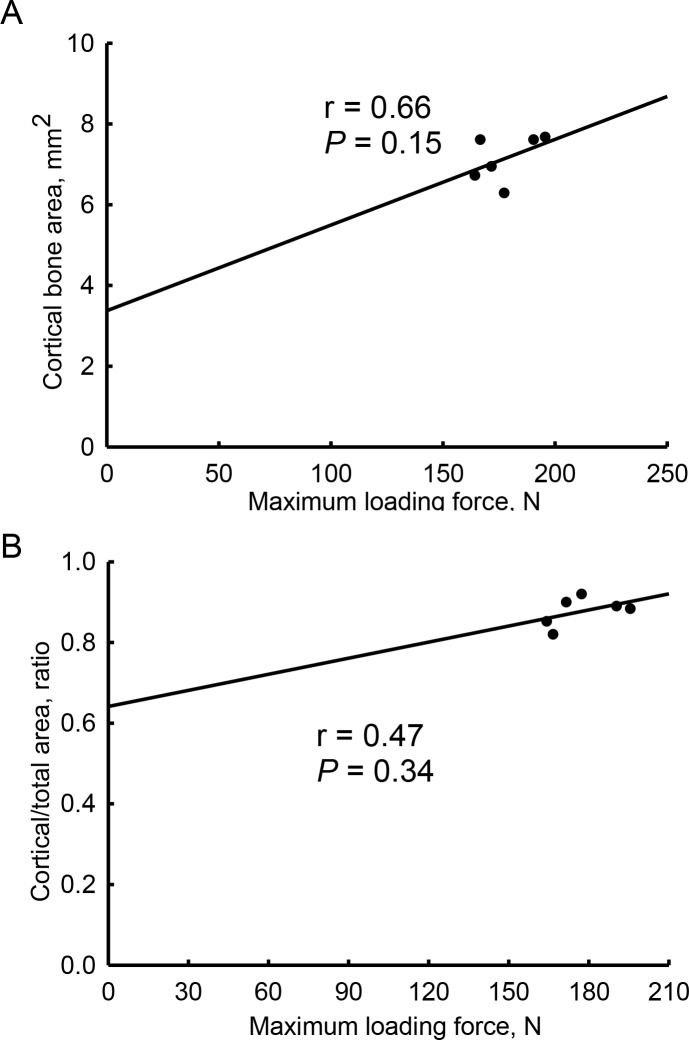
Fig 6. Associations of the biomechanical maximum loading force with tomographic parameters in orchiectomy-treated cortical bone.
Cortical bones from sham-operated and orchiectomized rats were analyzed using micro-computed tomography and a reduced-platen compression test. The tomographic cortical bone area, ratio of cortical bone area over the total bone section area, and mechanical maximum loading force were measured. Correlations of the mechanical maximum loading force with the tomographic cortical bone area (A) and ratio of cortical bone area over total bone section area (B) were analyzed using linear regressions.

