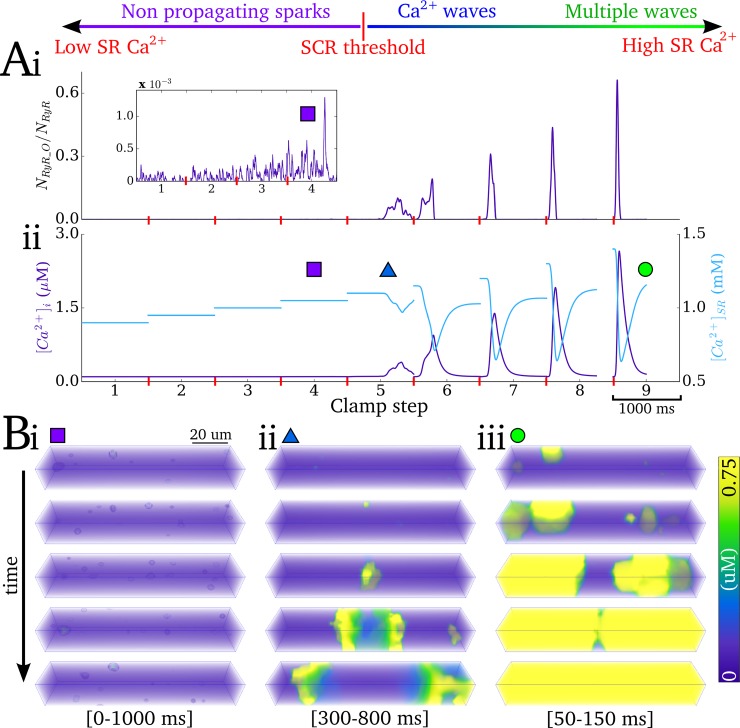
Fig 2. Illustration of Ca2+ clamp protocol.
A–Ca2+ clamp protocol illustrated for 9 steps of SR-Ca2+, showing traces for: (i) proportion open RyR; (ii) intracellular- (purple) and SR- (blue) Ca2+ concentration. B–Snapshots of the spatio-temporal Ca2+ dynamics at different SR-Ca2+ concentrations, showing: (i) non-propagating sparks; (ii) slow Ca2+ wave; (iii) multiple and rapid Ca2+ waves; the time range for the snapshots is shown in the square brackets. The data shown are clipped to the first of the two seconds associated with each clamp step in order to clearly visualise the waveforms.

