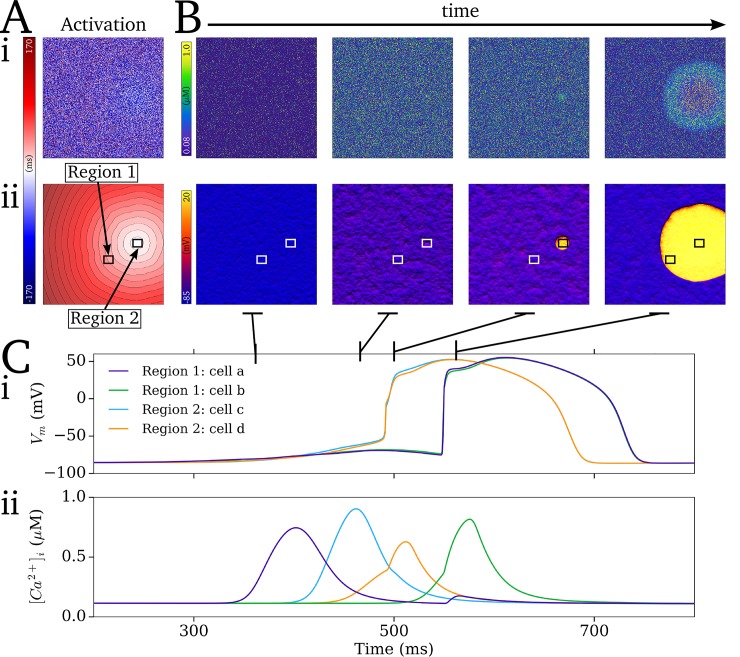
Fig 8. The role of electrotonic coupling in overcoming source-sink mismatch.
A–Activation maps for intracellular Ca2+ (i) and membrane potential (ii) associated with a spontaneous focal excitation. Note that the time of the initiation of focal excitation (t = 0 ms) corresponds to the halfway point of the colour map. B–Temporal snapshots of Ca2+ (i) and Vm (ii) associated with the onset of focal excitation. C–Vm (i) and Ca2+ (ii) traces from individual cells from two regions with the tissue (labelled in Aii) illustrating the independent (Ca2+) and coupled (Vm) cellular behaviour.

