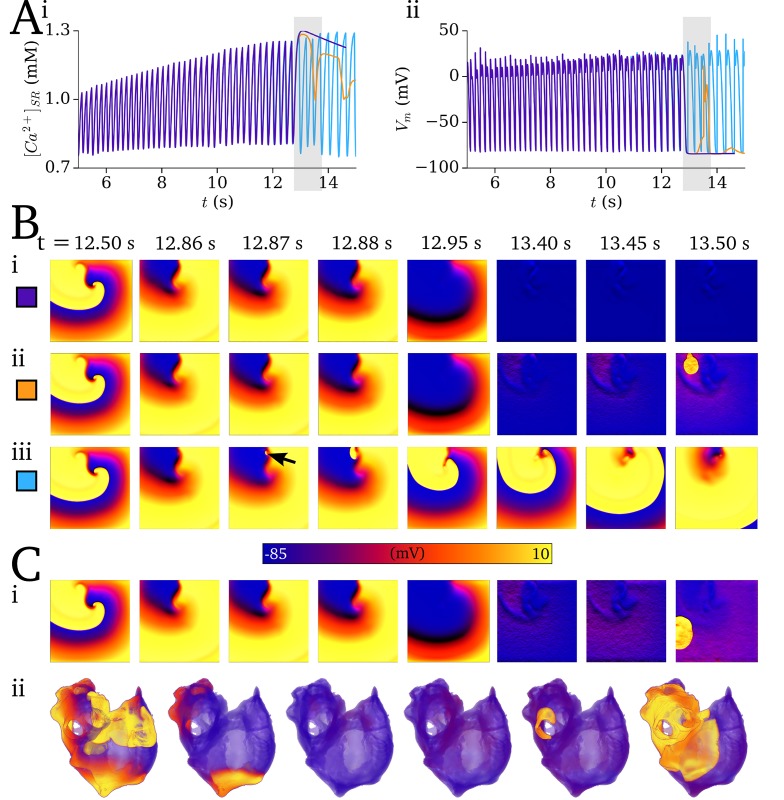
Fig 11. Coupling between re-entry and SCRE.
A–SR-Ca2+ concentration (i) and Vm (ii) associated with sustained re-entry followed by self-termination (at around 13 s), simulations without SCRE (purple) and with the General Dynamic SRF model with two different thresholds (orange, 1.125 mM; blue, 1.0 mM). B–Temporal snapshots of voltage in the 2D sheet associated with the traces shown in A, showing self-termination (i) and the emergence of delayed (ii, corresponding to the orange traces in A) and rapid (iii, corresponding to the blue trace in A) focal excitations. C–Examples of non-localised focal excitations emerging in the 2D sheet (i) and 3D whole atria models (ii). Baseline General Dynamic SRF parameters, corresponding to panel A(orange)/Bii: CaSRthreshold = 1.25 mM; CaSRmax = 1.525 mM; CaSRP_range = 0.05 mM; ti,Sepmin = 300 ms; ti,Sepmax = 870 ms; ti,widthmin = 200 ms; ti,widthmax = 1000 ms; MDmin = 150ms; MDmax = 600 ms; λwidthmin = 70 ms; λwidthmax = 300 ms; Hwidth = 2.5. Parameter differences for panel A(blue)/Biii: CaSRthreshold = 1.00 mM; CaSRmax = 1.2 mM; ti,Sepmin = 30 ms; MDmin = 50ms; λwidthmin = 20 ms. For panel Ci: MDmin = 160ms; λwidthmin = 75 ms; λwidthmax = 300 ms. For panel Cii: CaSRthreshold = 0.9 mM; CaSRmax = 1.3 mM; ti,Sepmin = 30 ms; ti,widthmin = 20 ms; MDmin = 80ms; MDmax = 800 ms; λwidthmin = 20 ms.

