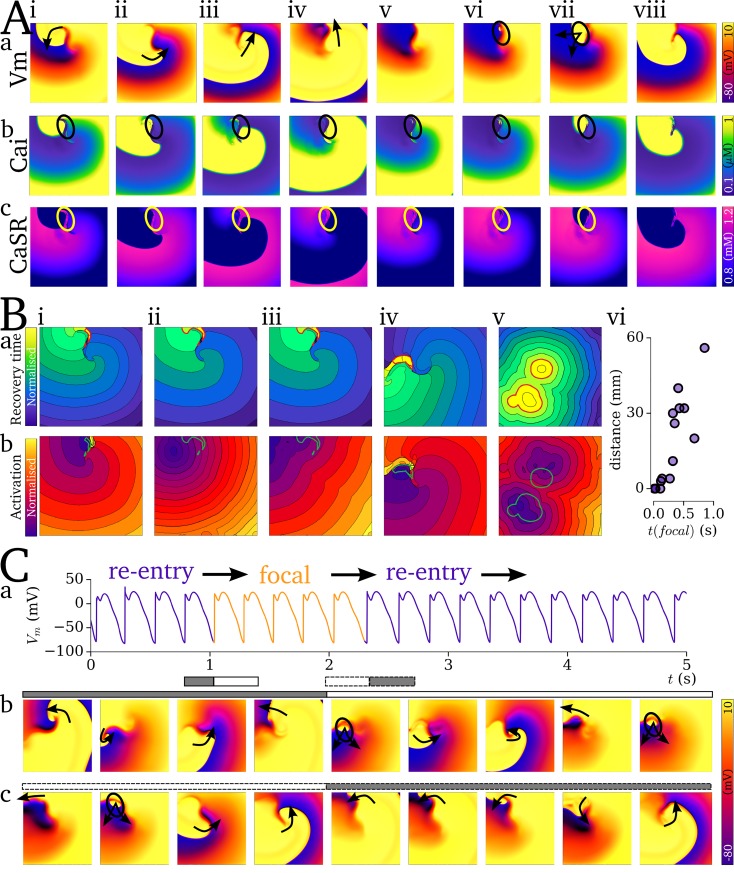
Fig 12. Functional localisation of re-entry and focal activity.
A–Temporal snapshots (i-viii) of voltage (a), intracellular Ca2+ (b), and SR-Ca2+ (c) associated with the final, self-terminating re-entrant cycle and first focal excitation. Arrows in (a) indicate the conduction of the re-entrant and then focal excitations. Highlighted region (circle) illustrates the island of large SR-Ca2+ associated with the unexcited scroll wave core (i-iv) and its correlation with the focus of ectopic activation (vi-vii). B–Examples of recovery time maps (a) and focal activation maps (b) for 5 independent simulations (i-v; selected from simulations covering the full range of coupled AP models and tissue parameters which led to transient re-entry which sustained sufficiently to load the SR-Ca2+) associated with the self-termination of re-entry followed by ectopic excitation. The contour surrounding the region of longest recovery time (corresponding to the unexcited core illustrated in A) is highlighted in red in the recovery time map and green in the activation maps. (vi)—summary of the correlation between distance between from centre of the focal source to the closest edge of the region of longest recovery and the time of the focal excitation, t(focal), relative to the latest activation of the non-focal excitation. C–Mechanism switching between re-entrant and focal excitation, showing the AP from a randomly selected cell (a) and temporal snapshots associated with the transition from re-entry to focal activity (b) and focal activity to re-entry (c). Snapshots corresponds to the temporal range illustrated by the grey and white bars with solid (re-entry to focal) and dashed (focal to re-entry) borders. Parameters which led to the mechanism switching simulation: CaSRthreshold = 1.0 mM; CaSRmax = 1.2 mM; CaSRP_range = 0.05 mM; ti,Sepmin = 30 ms; ti,Sepmax = 870 ms; ti,widthmin = 20 ms; ti,widthmax = 200 ms; MDmin = 50ms; MDmax = 800 ms; λwidthmin = 20 ms; λwidthmax = 300 ms; Hwidth = 2.5.

