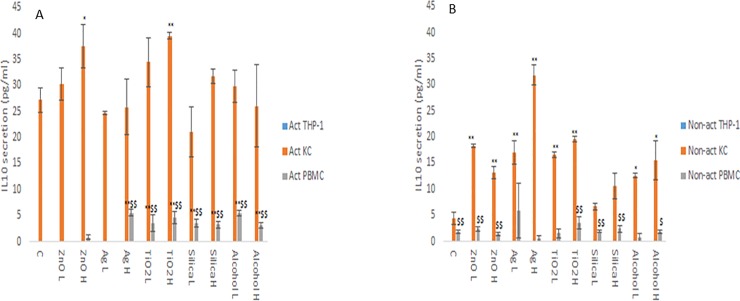
Fig 4. IL10 secretion from activated and non-activated THP-1, KC and PBMCs exposed to NMs or ethanol.
The cells were cultured with cell medium (C) or exposed to the xenobiotic for a period of 24 hr a) IL10—activated macrophages, b) IL10—non-activated macrophages. The values represent mean ± SEM (n = 3) with significance indicated by * p <0.05 and ** p <0.005 of NM-induced effects compared to negative control, $ p <0.05 and $$ p <0.005 signifying statistical differences between the cell types. In order to avoid asymmetry in the statistical distribution of the data the cell population that was clearly different from the others with regards to cytokine secretion levels was excluded in the statistical analysis—i.e. KC for IL10.

