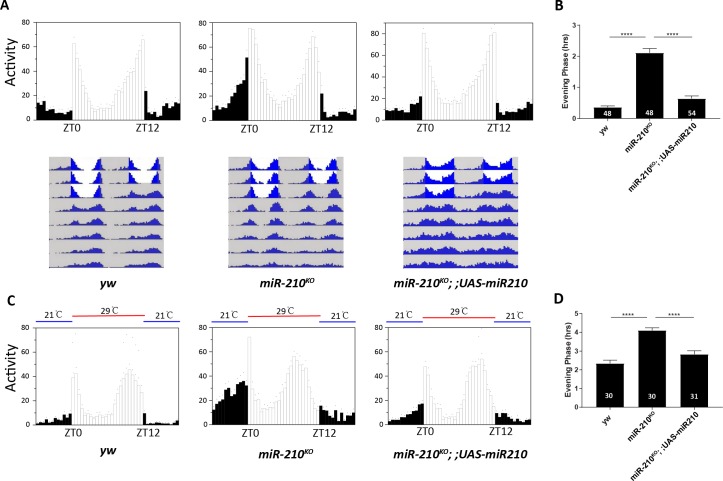
Fig 1. Loss of miR-210 advances evening peak activity under LD and temperature cycles (TC).
(A) Upper panel: representative eduction profiles of fly locomotor activity under 12:12 LD cycle. Black represents the dark phase, while white represents the light phase. Eduction is analyzed based on average of 3 days LD. Lower panel: representative double plotted actograms of flies under LD and DD conditions. Grey shadow represents the dark phase, while white represents the light phase. Here the knocking-in miR-210 GAL4 (miR-210KO) was used to express UAS-miR210 for rescue. (B) Quantification of evening phase of flies under LD. Phase point is determined by the time differences between the peak of evening activity and light off time. Number of flies tested is listed in each bar. Error bars indicate Standard Error. **** = p<0.0001, determined by Student’s t test. (C) Representative eduction profiles of flies under 29°C: 21°C temperature cycles (TC) in DD. Blue represents 21°C for 12 hours, while red represents 29°C. (D) Quantification of evening phase of flies under TC. Error bars represent Standard Error. **** = p<0.0001 was determined by Student’s t test.

