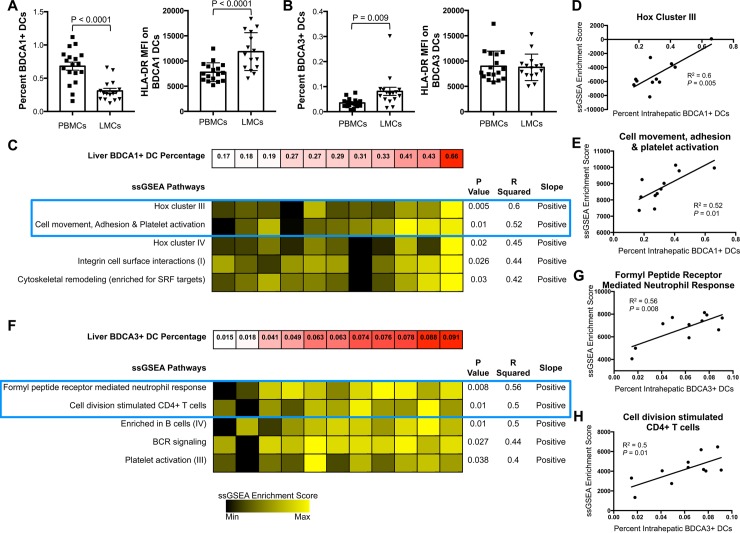
Fig 3. Analysis of BDCA1+ and BDCA3+ DCs.
(A) Frequency of BDCA1+ DCs in LMCs/PBMCs (left) and MFI of HLA-DR on BDCA1+ DCs (right). (B) Frequency of BDCA3+ DCs in LMCs/PBMCs (left) and MFI of HLA-DR on BDCA3+ DCs (right). Horizontal bars depict mean±SD. N = 16, paired t test. (C) Top pathways from ssGSEA analysis of microarray data isolated from whole liver tissue that correlated with percent of intrahepatic BDCA1+ DCs. Examples of two top scatter plots are encompassed in blue box and in D and E. (D) Scatter plot of “Hox Cluster III” pathway from C. (E) Scatter plot of “Cell movement, adhesion, and platelet activation” pathway from C. (F) Top pathways from ssGSEA analysis of microarray data isolated from whole liver tissue that correlated with percentage of intrahepatic BDCA3+ DCs. Examples of two top scatter plots are encompassed in blue box and in G and H. (G) Scatter plot of “Formyl Peptide Receptor Mediated Neutrophil Response” pathway from F. (H) Scatter plot of “Cell division stimulated CD4+ T cells” pathway from F. N = 11, Pearson’s correlation coefficient.

