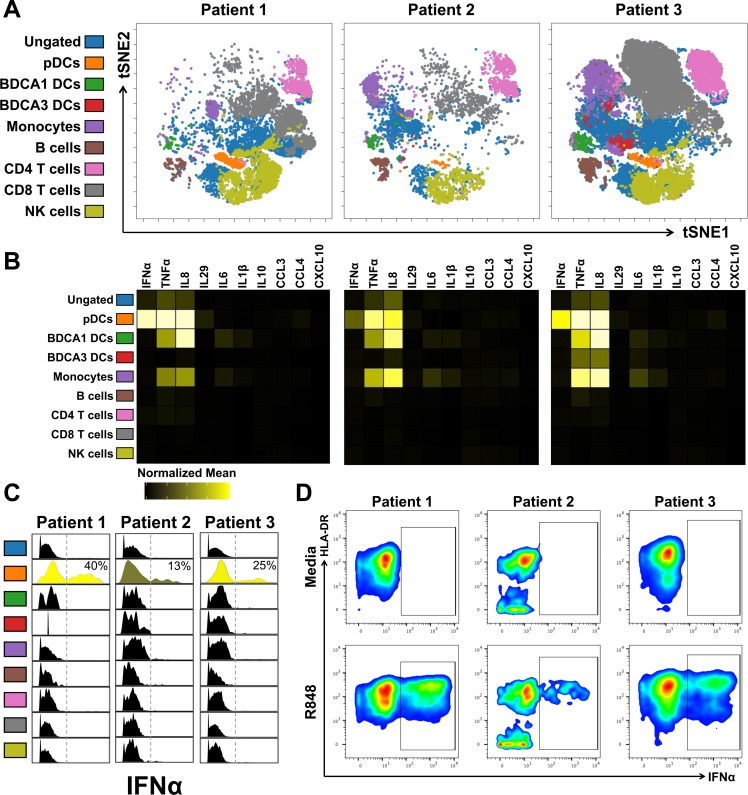
Fig 4. IFNα was made exclusively by pDCs.
(A) Unbiased viSNE plot of CyTOF data from R848-stimulated LMCs of 3 HCV+ individuals. Major immune subsets were manually gated and mapped onto viSNE plot. (B) Heatmap of normalized mean signal intensity (nMSI) of all cytokines/chemokines for each immune subset. (C) Histogram of signal intensity of IFNα for each immune subset; insert is percent pDCs expressing IFNα. (D) Manual gating of IFNα+ pDCs for 3 HCV+ individuals both with and without stimulation.

