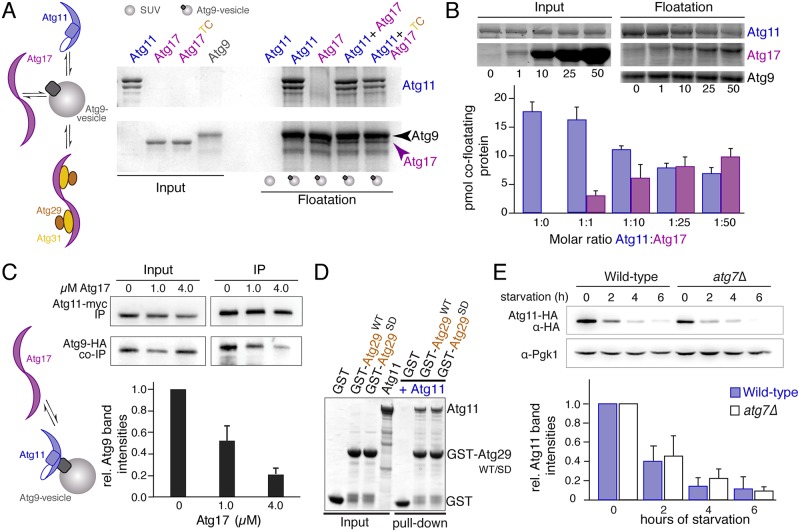
Fig 3. Atg11 and Atg17 compete for Atg9.
Schematic drawing illustrates the addressed question but proteins are not drawn to scale. (A) SDS-PAGE gel of input (20% of protein used for cofloatation) and floated fractions from cofloatation experiments of Atg9-PLs with recombinant Atg11, Atg17, and Atg17TC. SUVs lacking Atg9core [11] served as control for unspecific membrane binding. (B) SDS-PAGE gel of input (20% of protein used for cofloatation) and floatation fractions from cofloatation experiments of Atg9-PLs with different stoichiometric ratios of recombinant Atg11 and Atg17 as indicated. The chart shows quantifications of relative band intensities as shown in the SDS-PAGE gel above from three independent experiments. Data are shown as mean ± SD. Amounts were calculated using the input band intensities which correspond to known protein quantities as internal reference. (C) Western blots of lysates and samples from immunoprecipitations of nonstarved cells expressing myc-tagged Atg11 and HA-tagged Atg9, using anti-myc and anti-HA antibodies, respectively. Cell lysates were incubated with buffer (0 μM) or purified Atg17 at a final concentration of 1 and 4 μM. Atg11 was immunoprecipitated using anti-myc antibodies bound to Protein A magnetic beads. The chart shows quantification of the relative HA-Atg9 band intensities from three independent experiments, corrected by the amount of immunoprecipitated Atg11-myc and normalized to the control sample (0 μM Atg17). Data are shown as mean ± SD. (D) SDS-PAGE gel of input and pull-down fractions from pull-down assay using 10 μg recombinant GST-tagged WT (Atg29WT) or phosphomimetic Atg29 (Atg29SD), coupled to Glutathione-resin, with recombinant Atg11. GST served as negative control. Input corresponds to 20% of total protein. Full gel is shown in S5 Fig. (E) Western blots of lysates from wildtype and atg7 knock-out cells that expressed Atg11-HA using anti-HA antibodies. Pgk1 served as loading control. The chart shows quantifications of blots from three independent experiments, normalized to the amount of Pgk1, relative to the amount in nonstarved cells, which was set to 1. Data are shown as mean ± SD. Uncropped original blots are shown in S5 Fig. GST, glutathione-S-transferase; HA, hemagglutinin; PL, proteoliposome; SUV, small unilamellar vesicle; WT, wild-type.

