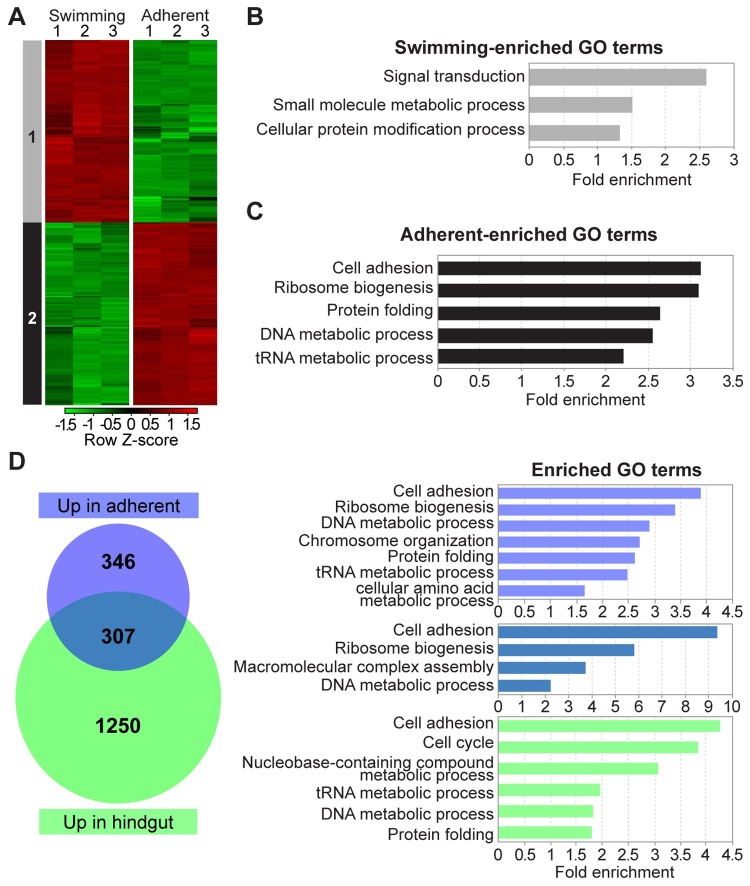
Fig 6. Differentially expressed genes in cultured swimming and cultured adherent C. fasciculata.
(A) Heat-map showing gene expression levels of genes differentially expressed by at least two-fold with an adjusted P value p<0.01 across three replicates of swimming cells and three replicates of adherent cells. Replicate number is shown at the top of the heat map. Each row represents a gene, and rows were clustered according to their expression pattern. Group 1 genes are upregulated in swimming cells relative to adherent cells. Group 2 genes are downregulated in swimming cells relative to adherent cells. Red, upregulated; green, downregulated. (B)(C) Gene ontology (GO) enrichment analysis (using GO Slim terms) of genes in groups shown in A was performed on TriTrypDB. p<0.05. (D) Analysis of differentially expressed genes in all nine samples (three replicates each of swimming, adherent, and infected hindguts). Venn diagram showing the degree of overlap in transcripts upregulated in cultured adherent parasites and hindgut-adherent parasites (both relative to cultured swimming cells). GO Slim terms enriched in each group (p<0.05) are shown in color-coded graphs on the right.

