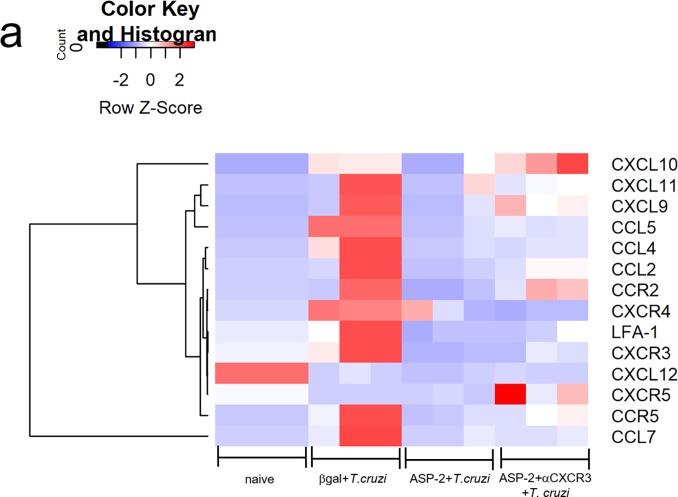
Fig 6. CXCR3 ligands were expressed in heart of infected mice.
a-The heatmap graph represents the fold change of chemokine genes in heart of βgal+T.cruzi, ASP2+T.cruzi, and ASP2+αCXCR3+T.cruzi groups. The quantification of chemokines gene expression in heart was on day 20 after infection and we used a customized plate (Mouse Chemokines Plate targets genes). Results are shown as individual values and the mean ± SEM for each group (n = 3).

