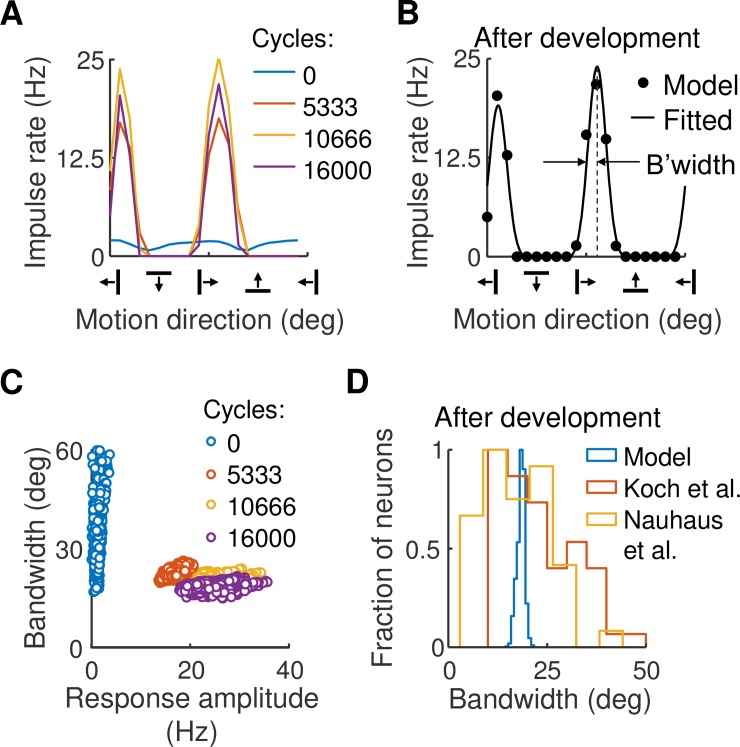
Fig 5.
A. Orientation tuning curves for the excitatory neuron whose weights are shown in Fig 3B. Four cycles in the development process are given. At the beginning of development, orientation tuning is poor. Later in development two tuning peaks arise, one due to grating motion in one direction and the other for the opposite direction. B. A tuning curve was fitted to the post-development data in part A. The model comprised the sum of two von Mises functions separated by 180°. C. Tuning bandwidth, measured as half width at half height, was obtained from the fitted curve in part B. Bandwidth is shown as a function of maximum response amplitude for each neuron in the central 2°×2° of the visual field patch; each circle represents one neuron. Bandwidths range from small to large at the start of development but are uniformly low post-development. D. Frequency histogram of bandwidths comparing values in the model with those found in the cortex by Koch et al. [27] and Nauhaus et al. [28]. Bandwidth estimates in the model fall within these empirical findings.

