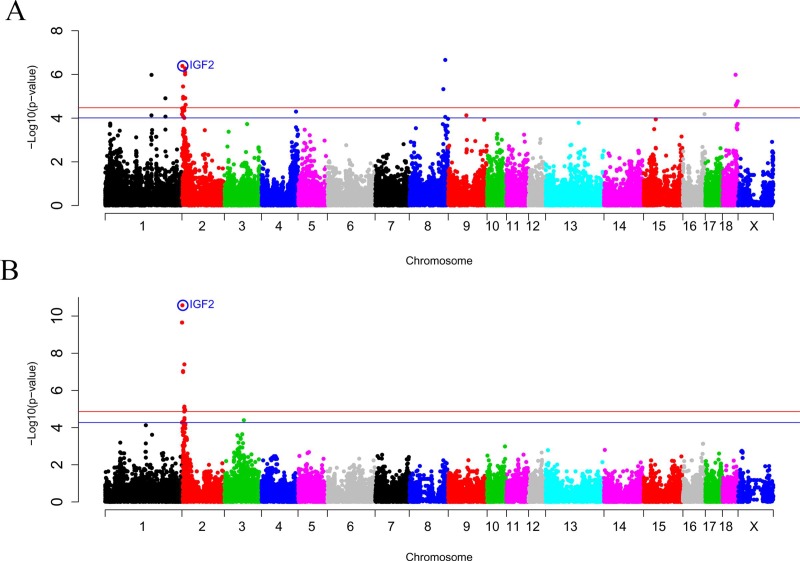
Fig 2.
GWAS plot of adipose tissue IGF2 gene expression in (A) BC1_DU and (B) BC1_PI. Chromosome positions in Mb based on S. scrofa 11.1 assembly of the pig genome are represented in the X-axis and the–log10 (p-value) is on the Y-axis. The red horizontal line indicates the genome-wide significant level (FDR-based q-value < 0.05) and the blue horizontal line represents the genome-wide suggestive level (FDR-based q-value <0.1). The IGF2:g.3072G>A polymorphism is circled and labelled as IGF2 in colour blue.

