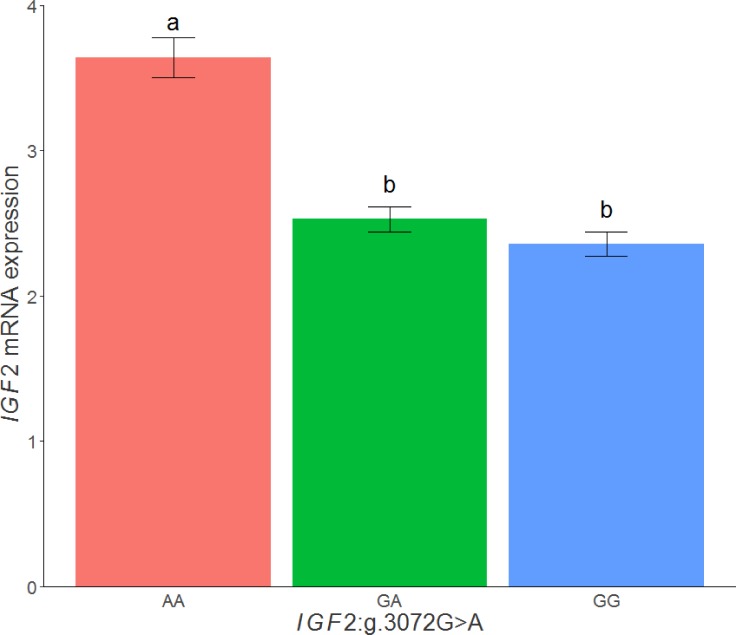
Fig 3. Plot of relative quantification of IGF2 mRNA levels in adipose tissue of the 3BCs according to the IGF2:g.3072G>A SNP genotypes.
Data represents means ± standard error of mean (SEM). Values with different superscript letters (a, b) indicate significant differences between groups (P-value <0.05).

