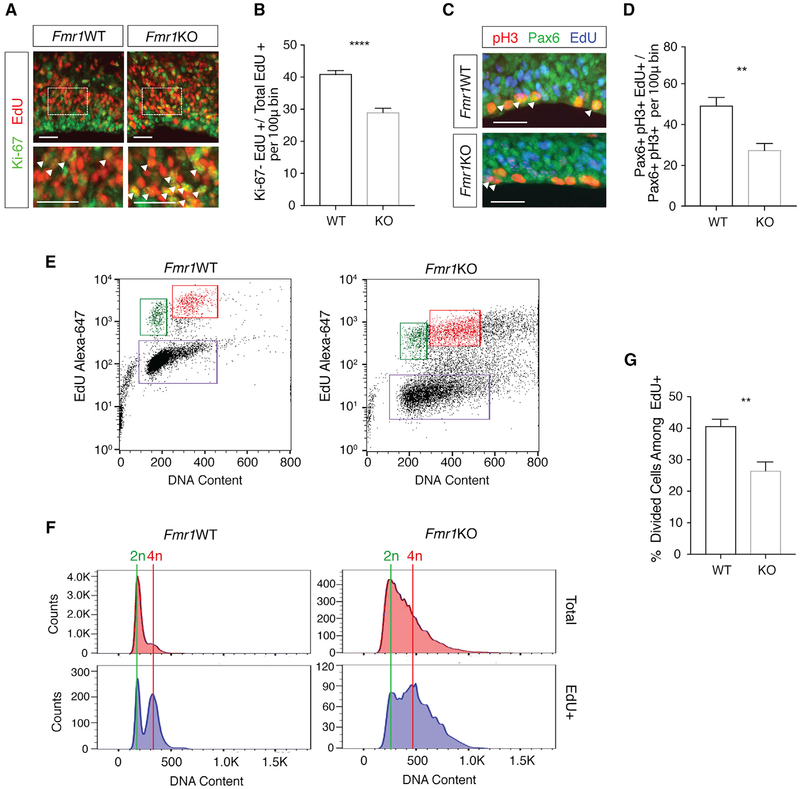
Figure 1. Genetic Knockout of Fmr1 Leads to Delayed Neural Progenitor Cell Cycle Progression.
(A) Analysis of cell cycle exit in WT and Fmr1KO E17.5 cortical progenitors. EdU (24 h) staining is shown in red and Ki-67 in green. Enlarged sections (bottom) highlight Ki-67+EdU+ cells (arrows). Scale bars, 25 μm.
(B) Significantly fewer EdU+ cells exit the cell cycle during the 24-h EdU exposure in Fmr1KO cortex (****p ≤ 0.0001; n = 5 WT, 6 KO mice). Data are presented as mean + SEM.
(C) Analysis of M phase entry in WT and Fmr1KO cortical progenitors. pH3 staining is shown in red, Pax6 in green, and EdU in blue. Scale bar, 25 μm.
(D) Significantly fewer EdU+ RGCs entered mitosis within the 2-h EdU exposure in Fmr1KO cortex (**p = 0.0017; n = 6 WT, 6 KO mice). Data are presented as mean + SEM.
(E) FACS analysis of cell cycle dynamics in WT and Fmr1KO NPCs. Cells labeled by EdU are shown in the upper quadrants. Cells that divided during the 5-h incubation are shown in green and cells remaining in G2/M are in red.
(F) Histograms comparing 2n (divided) and 4n (undivided) NPCs between WT and Fmr1KO.
(G) Significantly fewer Fmr1KO EdU+ NPCs completed division by the end of 5 h compared to EdU+ WT NPCs (**p = 0.0018; n = 6 WT, 6 KO mice). Data are presented as mean + SEM.

