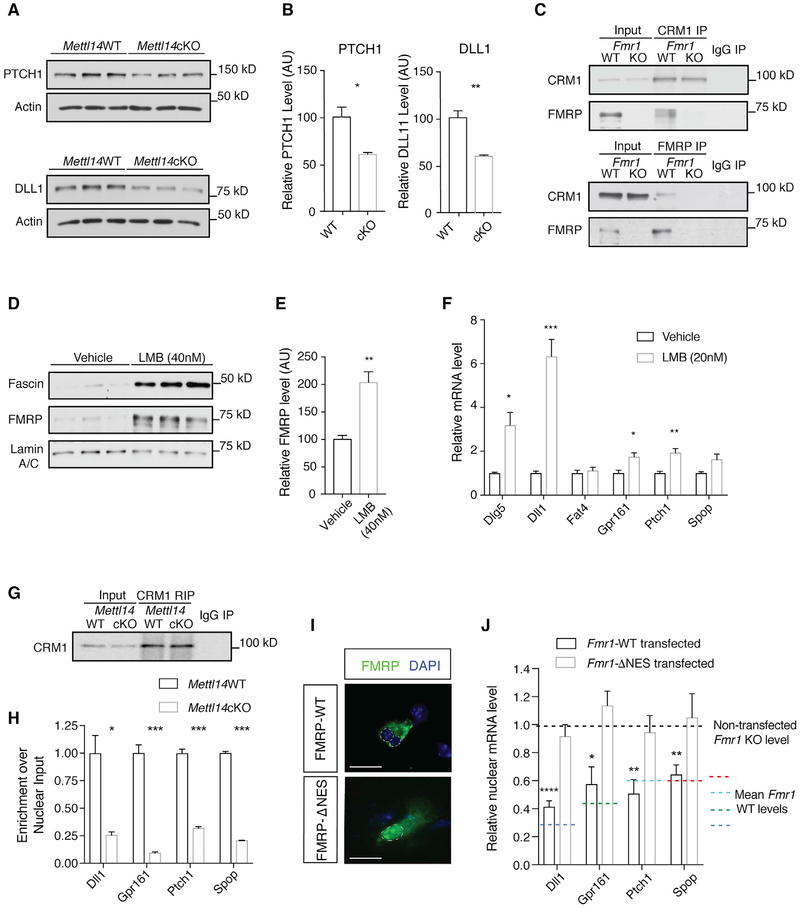
Figure 4. FMRP Mediates the Nuclear Export of m6A-Tagged FMRP Target mRNAs through CRM1.
(A) Western blot of PTCH1 and DLL1 in WT and Mettl14cKO NPC whole-cell lysates.
(B) PTCH1 (*p = 0.0178; n = 3 WT, 3 cKO biological replicates) and DLL1 (**p = 0.0045; n = 3 WT, 3 cKO biological replicates) protein levels are significantly decreased in Mettl14cKO NPCs. Data are presented as mean + SEM.
(C) Immunoprecipitation of CRM1 (top) or FMRP (bottom) co-precipitates FMRP or CRM1, respectively, in the WT mouse cortex.
(D) Western blot of CRM1 inhibition by LMB in WT NPC nuclear fractions. Lamin A-C serves as loading control and fascin as a positive control.
(E) The nuclear FMRP level is elevated in WT NPCs following LMB treatment (40 nM) (**p = 0.0069; n = 3 biological replicates). Data are presented as mean + SEM.
(F) Notch- and Hedgehog-related RNAs show nuclear retention in WT NPCs following LMB treatment (20 nM) quantified by qRT-PCR: Dlg5 (*p = 0.0170), Dll1 (***p = 0.0006), Fat4 (p = 0.5815), Gpr161 (*p = 0.0154), Ptch1 (**p = 0.0048), and Spop (p = 0.0518); n = 4 vehicle, 6 LMB biological replicates. Normalization is to Snora3. Data are presented as mean + SEM.
(G) CRM1 RIP from WT or Mettl14cKO NPCs.
(H) CRM1 binding to Notch- and Hedgehog-related RNAs is reduced in Mettl14cKO NPCs quantified by qRT-PCR: Dll1 (**p = 0.01), Gpr161 (***p = 0.00029), Ptch1 (***p = 0.0002), and Spop (****p < 0.0001); n = 3 biological replicates. Normalization is to U1. Data are presented as mean + SEM.
(I) Cytoplasmic localization of FMRP-WT and nuclear localization of FMRPΔNES in Fmr1KO NPCs. Scale bar, 20 μm.
(J) Nuclear retention of target mRNAs in Fmr1KO NPCs is rescued by the expression of WT (Dll1 [****p < 0.0001], Gpr161 [*p = 0.026], Ptch1 [**p = 0.008], and Spop [**p = 0.006]; n = 3 biological replicates) but not ΔNES Fmr1 (Dll1 [p = 0.372], Gpr161 [p = 0.253], Ptch1 [p = 0.672], Spop [p = 0.78]; n = 3 biological replicates). Data are presented as mean + SEM.

