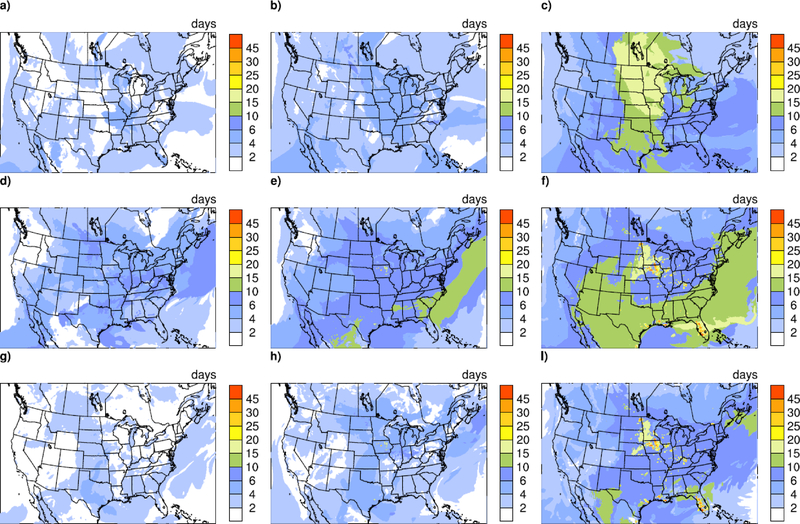
Figure 3.
Figures 3a-c show maps of the number of days needed for differences in daily average ozone concentrations in model layer 1 between the SPRING_PROF and BASE case to drop to below 10%/5%/1% of the grid-cell specific period-average BASE ozone mixing ratio. Figures 3d-f show the corresponding results for the SUMMER_PROF case, and Figures 3g – i show the corresponding results for the SUMMER_CIFS case. Additional details on the computation of the values displayed in the maps are provided in the text.

