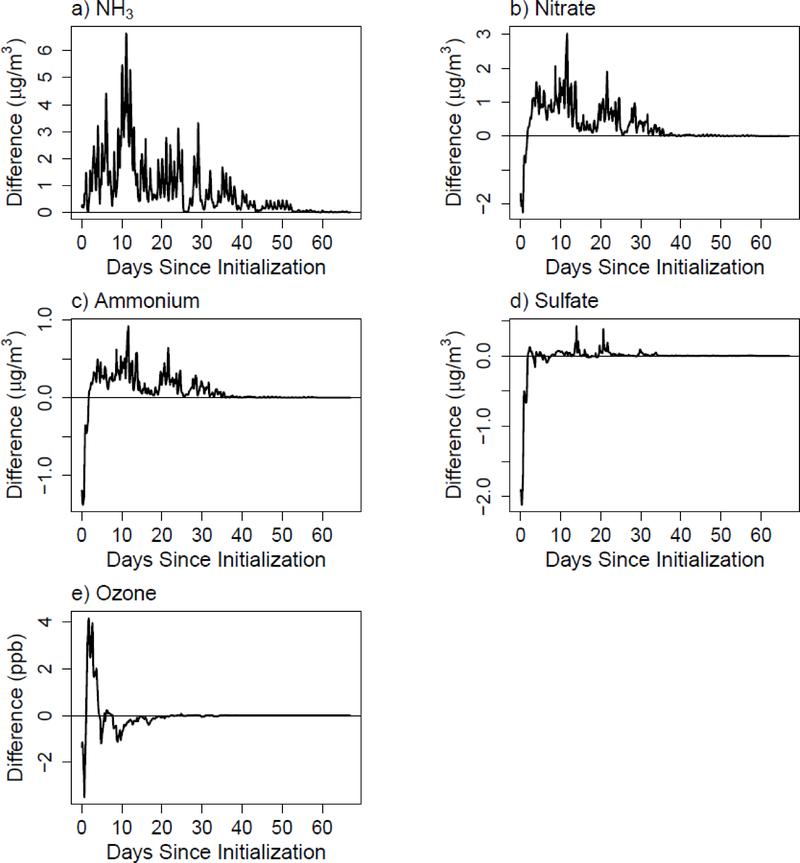
Figure 6.
Time series of atmospheric concentration differences between the two simulations for the spring case, spatially averaged over eastern Kansas and Oklahoma. a) NH3, b) nitrate, c) ammonium, d) sulfate, and e) ozone. The difference was calculated by subtracting the results for the SPRING_PROF case initialized on February 23 from the results of the BASE case initialized on December 21.

