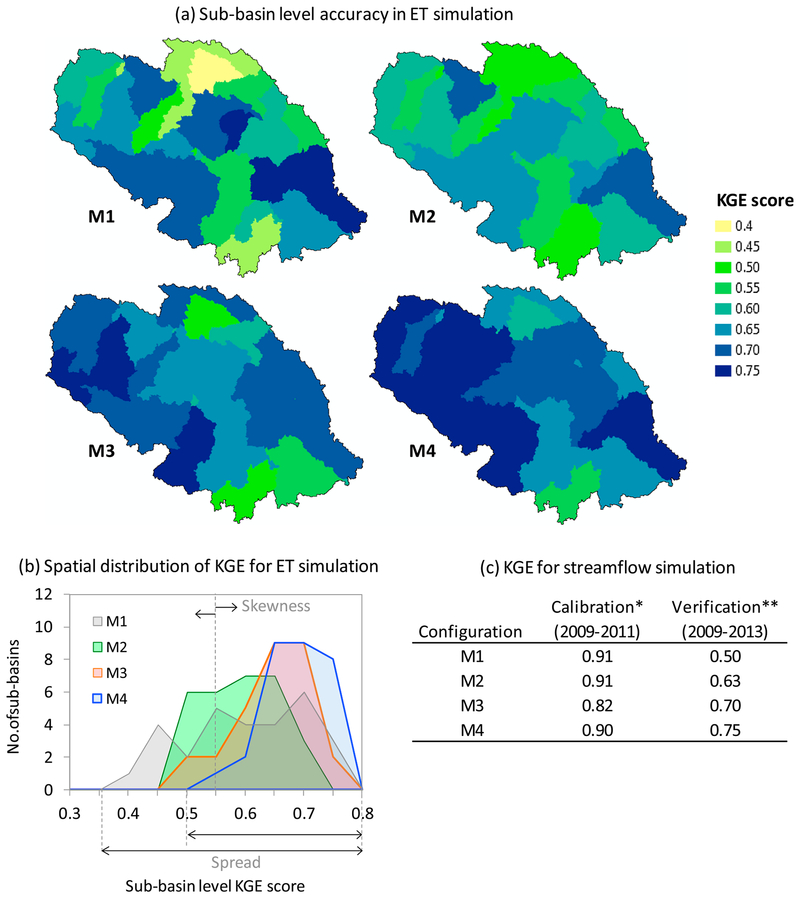
Fig. 4.
Goodness of model performance based on the most optimal parameter combination. KGE values shown here measure the agreement of the model with respect to MODIS ET at sub-basin level and USGS streamflow at the watershed outlet. All assessments are for daily simulation. While ET simulation performance shown here correspond only to the calibration period (2009–2011; Fig. 4a–b), streamflow simulation performance was reported both for calibration and verification (2009–2013; Fig. 4c): * using only the “observed” portion of the available USGS data; ** using both “observed” and “estimated” data (see Fig. A1 in appendix A for streamflow hydrographs).

