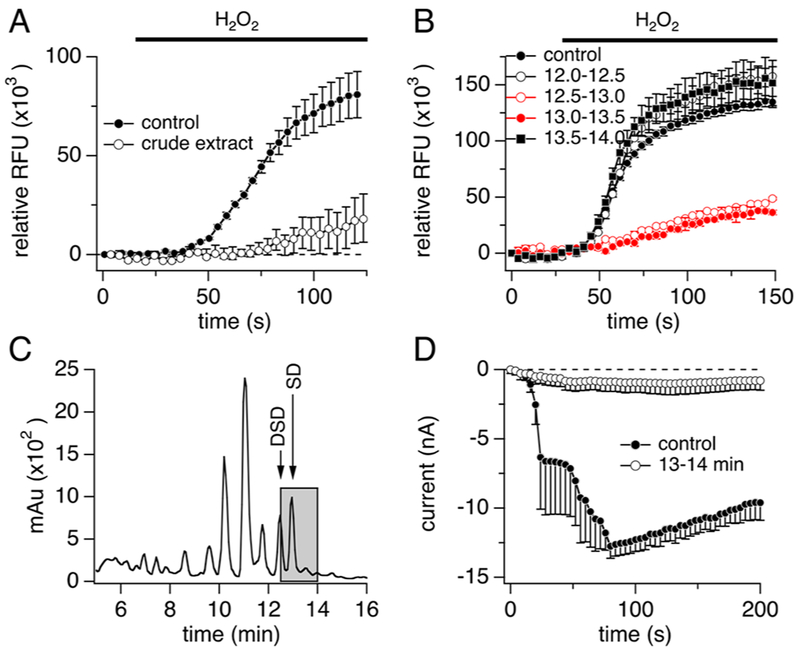
Figure 1.
Bioassay-linked fractionation of TRPM2-active organic extract of Cacospongia sp. (A, B) Hydrogen peroxide-induced Ca2+ entry in our calcium imaging assay using TRPM2-HEK293 cells following (A) treatment with vehicle control (closed circles, n = 15) versus an organic extract of Cacospongia sp. (open circles, n = 3) or (B)treatment with vehicle control (closed circles, n = 20) versus HPLC fractions of the extract eluting at 12.0–12.5 min (black trace, open circles, n = 2), 12.5–13.0 min (red trace, open circles, n = 2), 13.0–13.5 min (red trace, close circles, n = 2), or 13.5–14.0 min (black trace, closed squares, n = 2). H2O2 (250 μM) was added at 30 s. Fractions (approximately 17 μg/mL each) were incubated for 20–30 min. Cells were preincubated with fura-2 AM, and change in relative fluorescence units was measured at 510 nm after excitation at 340 nm.(C)Chromatogram of semipreparative reversed-phase HPLC of the organic extract residue. Eluent (2.0–30.0 min) was collected into 96-well plates in 30–60 s fractions and tested at proportional concentrations in the TRPM2 Ca2+ imaging assay. Components eluting between 12.5 and 13.5 min consistently concentrated TRPM2 inhibitory activity (grayed area) (see panel B). The major components eluting between 12.5 and 13.5 min were identified as the known scalaradial (SD) and 12-deacetylscalaradial (DSD), which were subsequently isolated and assayed. (D) Average normalized whole-cell current development of human TRPM2 overexpressed in HEK293 cells3 following treatment with vehicle control (closed circles, n = 4) versus HPLC fractions of the Cacospongia sp. extract eluting at 13.0–14.0 min (approximately 1 μg/mL, open circles, n = 4). Cells were incubated with the indicated fraction/control for 30–60 min in standard external Ringer’s solution before patching. Internal solution was unbuffered (no Ca2+ chelator) standard K-glutamate-based solution supplemented with 100 μM ADPR. Currents were elicited by voltage ramps from −100 mV to 100 mV over 50 ms at 0.5 Hz intervals. Current amplitudes were extracted at −80 mV, normalized to the current assessed at 100 s, averaged, and plotted versus time of the experiment. Induction time for tetracycline was 6–9 h. Error bars indicate SEM. For panels A, B, and D, data at the 100 s time point were statistically evaluated. Each of the following samples showed significance compared to control: (A) crude extract; (B) 12.5–13.0 and 13.0–13.5 min fractions; (D) 13.0–14.0 min fraction.

