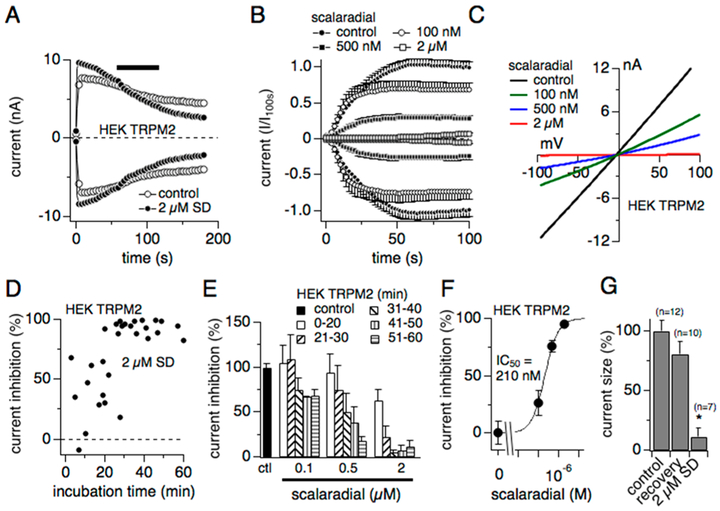
Figure 2.
Scalaradial inhibits TRPM2 in a concentration- and time-dependent manner. (A) Average normalized whole-cell current development of human TRPM2 overexpressed in HEK293 cells.3 Internal solution was standard K-glutamate-based solution with Ca2+ buffered to 300 nM and supplemented with 100 μM ADPR. Currents were elicited by voltage ramps from −100 mV to 100 mV over 50 ms at 0.5 Hz intervals. Current amplitudes were extracted at −80 and +80 mV, normalized to the control current assessed at 100 s, averaged, and plotted versus time of the experiment. Induction time for tetracycline was 6–9 h. Application of external solution supplemented with either vehicle (0.17% MeOH; open circles, control (n = 4)) or 2 μM scalaradial (closed circles (n = 7)) as indicated by the black bar. No statistical significance. Error bars are not shown. (B) Average normalized whole-cell current development of human TRPM2 overexpressed in HEK293 cells.3 Cells were incubated with the indicated concentrations of scalaradial for 30–60 min in standard external Ringer’s solution before patching (control: closed circles, n = 20; 100 nM: open circles, n = 10; 500 nM: closed squares, n = 15; 2 μM: open squares, n = 11). Solutions and data acquisition as in A. Error bars indicate SEM. (C) Current–voltage (I/V) relationship of TRPM2 currents extracted from representative cells at 100 s into the experiment and exposed to increasing concentrations of scalaradial between 30 and 60 min (control = black trace, 100 nM = green trace, 500 nM = blue trace, 2 μM = red trace). (D) Data cloud plot of time-dependent TRPM2 current inhibition as extracted from individual cells at −80 mV and 100 s and plotted against incubation time with 2 μM scalaradial. (E) Time-dependency of 0.1, 0.5, and 2 μM scalaradial on TRPM2 peak currents expressed in HEK293 cells. Scalaradial was added to TRPM2-overexpressing HEK293 cells in standard external solution. TRPM2 currents of individual cells were measured, and data from individual cells were pooled for different time periods with regard to incubation with scalaradial (0–20, 21–30, 31–40, 41–50, and 51–60 min). Induction time was 6–9 h. Internal solution as in panel A. Current amplitudes were extracted at −80 mV and 100 s and normalized to percent of controls recorded at the same day after a similar induction period (n = 4–12 per bin except n = 1 for bin 100 nM at 41–50 min; n = 20 for control). Error bars indicate SEM. (F) Concentration-response curve of TRPM2 currents to increasing concentrations of scalaradial. Normalized data were extracted at −80 mV and 100 s from panel B and plotted versus the respective scalaradial concentration. A dose-response fit to the data measured an IC50 of 210 nM with a Hill coefficient of 1.3. (G) Current size in % of TRPM2 currents without exposure to scalaradial (control), with 60 min of exposure to scalaradial and current assessment in external solution in the absence (recovery) or presence of 2 μM scalaradial (SD). Current amplitudes were assessed at −80 mV and 100 s into the experiment, evaluated as % of control, and averaged for display and statistical analysis. Error bars are SEM. Star indicates statistical significance with p < 0.001.

