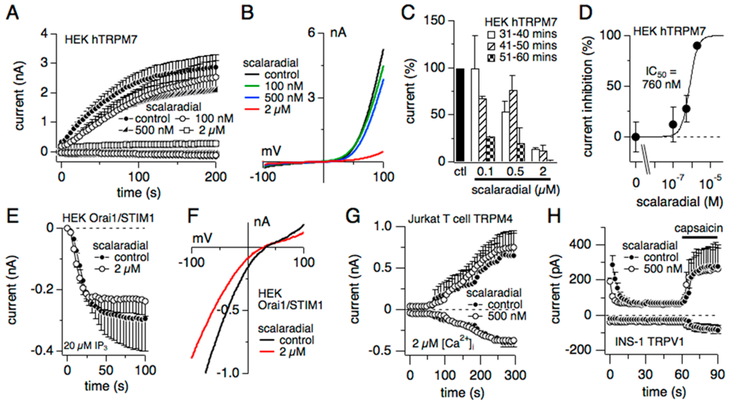
Figure 3.
Scalaradial inhibits TRPM7 but not CRAC currents. (A) Average whole-cell current development of mouse TRPM7 overexpressed in HEK293. Cells were incubated with 100 nM (open circles; n = 9), 500 nM (filled triangle; n = 10), or 2 μM scalaradial (open squares, n = 11) for 15 min in cell culture medium before whole-cell patch clamp or not (control, solid circles, n = 10). Maximum exposure time to scalaradial was 60 min. Tetracycline induction time was 19–22 h. Internal solution was standard K-glutamate solution supplemented with 10 mM K-BAPTA. Data were acquired and analyzed as in Figure 2A. Error bars are SEM. (B) Averaged current–voltage (I/V) relationship of TRPM7 currents extracted at 200 s into the experiment from data in panel A and exposed to control solution or solution supplemented with increasing scalaradial concentrations. (C) Analysis of time-dependent inhibition of TRPM7 by 100 nM, 500 nM, and 2 μM scalaradial compared to control. Same data as averaged in panel A (n = 2–3 per bin, except 100 nM at 51–60 min (n = 1)). (D) Concentration–response curve of TRPM7 currents to increasing concentrations of scalaradial. Normalized data were extracted at +80 mV at 200 s from panel A and plotted versus the respective scalaradial concentration. A concentration–response fit to the data measured an IC50 of 760 nM with a Hill coefficient of 2. (E) Average whole-cell CRAC currents measured in HEK293 cells transiently overexpressing Orai1 and stably expressing STIM1.26 Exposure to 2 μM scalaradial between 30 and 60 min (open circles, n = 9) did not significantly affect CRAC currents compared to control (closed circles, n = 7). Extracellular solution contained 10 mM CaCl2 and was NaCl-based (see Experimental Section). Intracellular solution was Cs glutamate-based and supplemented with 20 mM Cs- BAPTA and 20 μM IP3. Currents were elicited using a voltage ramp from −150 mV to +150 mV over 50 ms at 0.5 Hz. Current amplitudes were assessed at −80 mV, averaged, and plotted versus time of the experiment. Error bars indicate SEM. (F) Current–voltage (I/V) relationship of CRAC currents extracted from representative cells at 100 s into the experiment and exposed to control solution (black trace) or solution supplemented with 2 μM scalaradial (red trace). (G) Average whole-cell current development of endogenous TRPM4-like currents in Jurkat T lymphocytes. Cells were incubated with 500 nM scalaradial (open circles, n = 5) or no scalaradial (control, solid circles, n = 6) in standard external solution before whole-cell patch clamp. Internal solution was standard Cs-glutamate solution with intracellular Ca2+ clamped to 2 μM. Recordings were done within the first 60 min of incubation. Data were acquired and analyzed as in Figure 2A. (H) Average whole-cell current development of endogenous TRPV1-like currents in rat beta pancreatic INS-1 cells. Cells were incubated with 500 nM scalaradial (open circles, n = 8) in standard external solution before whole-cell patch clamp or no scalaradial (control, solid circles, n = 7). Recordings were performed with the first 60 min of incubation. Internal solution was standard Cs-glutamate solution with Ca2+ left unbuffered. Capsaicin (10 μM) in external solution was applied as indicated by the black bar. Data were acquired and analyzed as in Figure 2A.

