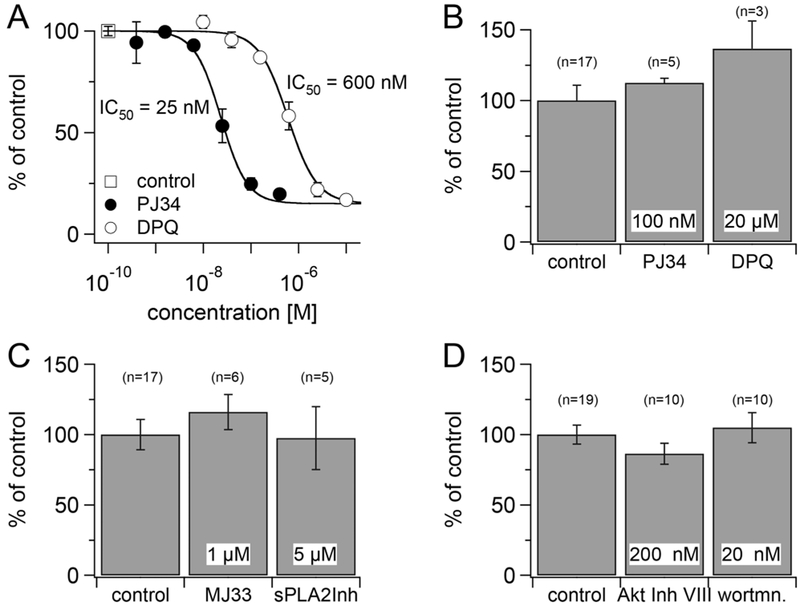
Figure 4.
Effect of PARP-1, sPLA2, and PI3K/Akt pathway inhibitors on TRPM2. (A) In a calcium imaging assay, TRPM2-HEK cells were plated and induced for 20 h. Following fura-2 AM loading, the PARP-1 inhibitors PJ34 and DPQ were added. Cells were stimulated with 1.0 mM H2O2 30 s after addition of the PARP-1 inhibitors, and the changes in intracellular [Ca2+] were followed for 120 s. Change of the Ca2+ signal is expressed as the maximum ratio change of fluorescence (at 510 nm, after excitation at 340/380 nm) normalized to vehicle as control (=100%). Each data point is the mean (±SEM) of quadruplicate determinations. Data are from one representative experiment. (B) In patch clamp experiments, TRPM2-HEK293 cells were incubated with the indicated concentrations of PARP-1 inhibitors in standard external Ringer’s solution, and whole-cell currents were recorded during the first 60 min. Internal solution was standard K-glutamate solution with 100 μM ADPR. Current amplitudes were extracted at −80 mV and normalized to percent of controls recorded on the same day. Bar graphs show means of n = 3–17. Error bars are SEM. (C) In patch clamp experiments, TRPM2-HEK293 cells were incubated with the indicated concentrations of sPLA2 inhibitor in standard external Ringer’s solution, and whole-cell currents were recorded during the first 60 min. Internal solution was standard K-glutamate solution with 100 μM ADPR. Current amplitudes were extracted at −80 mV and normalized to percent of controls recorded on the same day. Bar graphs show means of n = 3–17. Error bars are SEM. (D) In patch clamp experiments, TRPM2-HEK293 cells were preincubated for 60 min with the indicated concentrations of Akt and PI3K inhibitor in serum-containing medium, before being transferred into standard external Ringer’s solution. Currents were recorded in the continued presence of the inhibitors. Internal solution was standard K-glutamate solution supplemented with 500 μM ADPR. Current amplitudes were extracted at −80 mV and normalized to percent of controls recorded on the same day. Bar graphs show means of n = 10–19. Error bars are SEM.

