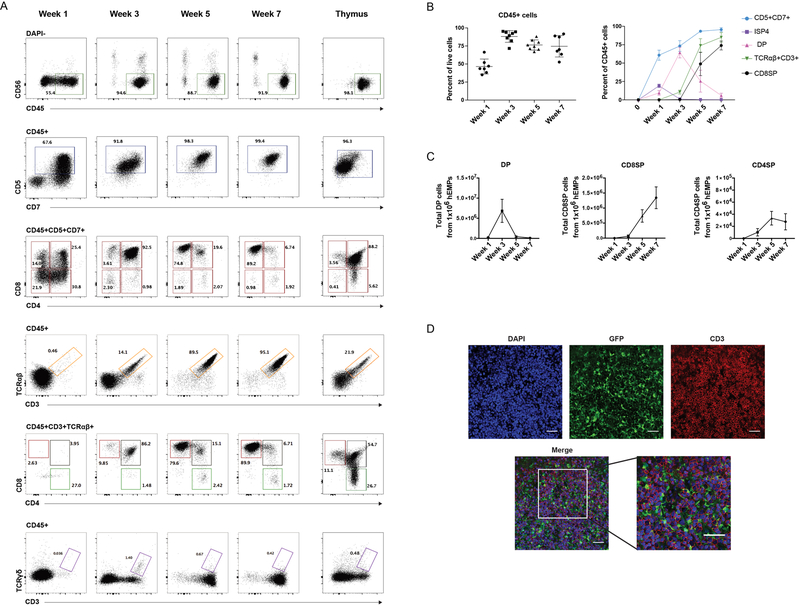
Figure 2: T cell development from human pluripotent stem cells (PSCs) in the ATO system.
(A) Representative kinetics (n=8 independent experiments) of T cell differentiation in PSC-ATPs from H1 ESCs at the time points shown. Total live cells are shown in the DAPI- gate. Subsequent parent gates are shown above each panel. Human postnatal thymocytes are shown on the far right for comparison. (B) Left: Frequency of hematopoietic (CD45+) cells in PSC-ATOs at the indicated time points (gated on DAPI- cells). Right: frequencies of precursor and mature T cell populations at the indicated time points (gated on CD45+ cells) (mean SD, n=8 independent experiments). (C) Numbers of DP cells, CD8SP cells (defined as CD3+TCR +CD8+CD4-) and CD4SP cells (defined as CD3+TCR +CD4+CD8-) generated from 1×10⁶ hEMP at indicated time points (mean SEM; n=8). (D) Representative whole-mount immunofluorescence analysis (n=3) of PSC-ATOs at week 5. Staining for GFP (marking MS5-DLL4 cells), CD3 (red), and DAPI (nuclear stain). Scale bars, 50 m.

