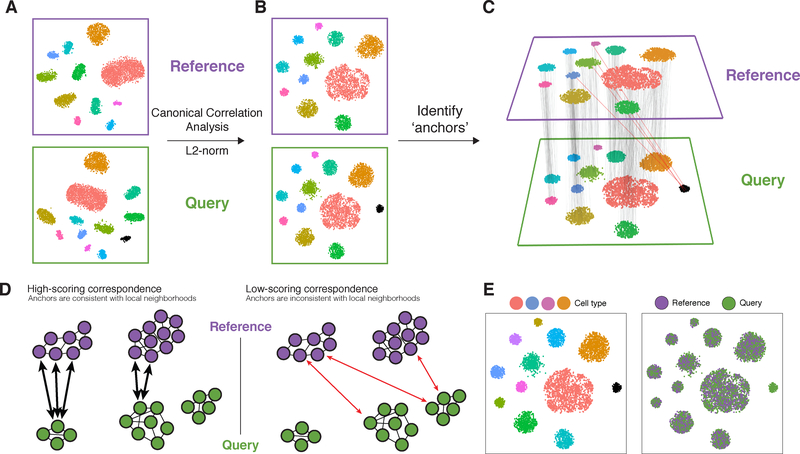
Figure 1. Schematic overview of reference “assembly” integration in Seurat v3.
(A) Representation of two datasets, reference and query, each of which originates from a separate single-cell experiment. The two datasets share cells from similar biological states, but the query dataset contains a unique population (in black). (B) We perform canonical correlation analysis, followed by L2-normalization of the canonical correlation vectors, to project the datasets into a subspace defined by shared correlation structure across datasets. (C) In the shared space, we identify pairs of mutual nearest neighbors across reference and query cells. These should represent cells in a shared biological state across datasets (grey lines), and serve as “anchors” to guide dataset integration. In principle, cells in unique populations should not participate in anchors, but in practice we observe “incorrect” anchors at low frequency (red lines). (D) For each anchor pair, we assign a score based on the consistency of anchors across the neighborhood structure of each dataset. (E) We utilize anchors and their scores to compute “correction” vectors for each query cell, transforming its expression so it can be jointly analyzed as part of an integrated reference.

